Intro text about the Alabama analysis
Plant Capacity
| Annual Capacity | |
|---|
| Tons/day | Metric Ton | Short Tons |
| 1,000 | 328,500 | 362,007 |
| 1,500 | 492,750 | 543,011 |
| 2,000 | 657,000 | 724,014 |
| 2,500 | 821,250 | 905,018 |
| 3,000 | 985,500 | 1,086,021 |
| 3,500 | 1,149,750 | 1,267,025 |
| 4,000 | 1,314,000 | 1,448,028 |
| 4,500 | 1,478,250 | 1,629,032 |
| 5,000 | 1,642,500 | 1,810,035 |
| 5,500 | 1,806,750 | 1,991,039 |
| 6,000 | 1,971,000 | 2,172,042 |
| 6,500 | 2,135,250 | 2,353,046 |
| 7,000 | 2,299,500 | 2,534,049 |
| 7,500 | 2,463,750 | 2,715,053 |
| 8,000 | 2,628,000 | 2,896,056 |
| 8,500 | 2,792,250 | 3,077,060 |
| 9,000 | 2,956,500 | 3,258,063 |
| 9,500 | 3,120,750 | 3,439,067 |
| 10,000 | 3,285,000 | 3,620,070 |
Assumes 90% operating efficiency
Dry Tons Required Annually by Percent Mix and Plant Capacity
Dry Tons of Pine Required Annually
| Percent Mix |
|---|
| Plant Capacity | 25 | 50 | 75 | 100 |
|---|
| Tons/day | dry tons per year |
|---|
| 1,000 | 90,502 | 181,004 | 271,505 | 362,007 |
| 1,500 | 135,753 | 271,506 | 407,258 | 543,011 |
| 2,000 | 181,004 | 362,007 | 543,011 | 724,014 |
| 2,500 | 226,255 | 452,509 | 678,764 | 905,018 |
| 3,000 | 271,505 | 543,011 | 814,516 | 1,086,021 |
| 3,500 | 316,756 | 633,513 | 950,269 | 1,267,025 |
| 4,000 | 362,007 | 724,014 | 1,086,021 | 1,448,028 |
| 4,500 | 407,258 | 814,516 | 1,221,774 | 1,629,032 |
| 5,000 | 452,509 | 905,018 | 1,357,526 | 1,810,035 |
| 5,500 | 497,760 | 995,520 | 1,493,279 | 1,991,039 |
| 6,000 | 543,011 | 1,086,021 | 1,629,032 | 2,172,042 |
| 6,500 | 588,262 | 1,176,523 | 1,764,785 | 2,353,046 |
| 7,000 | 633,512 | 1,267,025 | 1,900,537 | 2,534,049 |
| 7,500 | 678,763 | 1,357,527 | 2,036,290 | 2,715,053 |
| 8,000 | 724,014 | 1,448,028 | 2,172,042 | 2,896,056 |
| 8,500 | 769,265 | 1,538,530 | 2,307,795 | 3,077,060 |
| 9,000 | 814,516 | 1,629,032 | 2,443,547 | 3,258,063 |
| 9,500 | 859,767 | 1,719,534 | 2,579,300 | 3,439,067 |
| 10,000 | 905,018 | 1,810,035 | 2,715,053 | 3,620,070 |
Dry Tons of Switchgrass Required Annually
| Percent Mix |
|---|
| Plant Capacity | 75 | 50 | 25 |
|---|
| Tons/day | dry tons per year |
|---|
| 1,000 | 271,505 | 181,004 | 90,502 |
| 1,500 | 407,258 | 271,506 | 135,753 |
| 2,000 | 543,011 | 362,007 | 181,004 |
| 2,500 | 678,764 | 452,509 | 226,255 |
| 3,000 | 814,516 | 543,011 | 271,505 |
| 3,500 | 950,269 | 633,513 | 316,756 |
| 4,000 | 1,086,021 | 724,014 | 362,007 |
| 4,500 | 1,221,774 | 814,516 | 407,258 |
| 5,000 | 1,357,526 | 905,018 | 452,509 |
| 5,500 | 1,493,279 | 995,520 | 497,760 |
| 6,000 | 1,629,032 | 1,086,021 | 543,011 |
| 6,500 | 1,764,785 | 1,176,523 | 588,262 |
| 7,000 | 1,900,537 | 1,267,025 | 633,512 |
| 7,500 | 2,036,290 | 1,357,527 | 678,763 |
| 8000 | 2172042 | 1448028 | 724014 |
| 8500 | 2307795 | 1538530 | 769265 |
| 9000 | 2443547 | 1629031.5 | 814515.75 |
| 9500 | 2579300 | 1719533.5 | 859766.75 |
| 10000 | 2715053 | 1810035 | 905017.5 |
Dry Tons of Feedstock Required Annually
| Percent Mix |
|---|
| Plant Capacity | 25% Pine | 50% Pine | 75% Pine |
|---|
| Tons/day | dry tons per year |
|---|
| 1,000 | 362,007 | 362,007 | 362,007 |
| 1,500 | 543,011 | 543,011 | 543,011 |
| 2,000 | 724,014 | 724,014 | 724,014 |
| 2,500 | 905,018 | 905,018 | 905,018 |
| 3,000 | 1,086,021 | 1,086,021 | 1,086,021 |
| 3,500 | 1,267,025 | 1,267,025 | 1,267,025 |
| 4,000 | 1,448,028 | 1,448,028 | 1,448,028 |
| 4,500 | 1,629,032 | 1,629,032 | 1,629,032 |
| 5,000 | 1,810,035 | 1,810,035 | 1,810,035 |
| 5,500 | 1,991,039 | 1,991,039 | 1,991,039 |
| 6,000 | 2,172,042 | 2,172,042 | 2,172,042 |
| 6,500 | 2,353,046 | 2,353,046 | 2,353,046 |
| 7,000 | 2,534,049 | 2,534,049 | 2,534,049 |
| 7,500 | 2,715,053 | 2,715,053 | 2,715,053 |
| 8000 | 2,896,056 | 2,896,056 | 2,896,056 |
| 8500 | 3,077,060 | 3,077,060 | 3,077,060 |
| 9000 | 3,258,063 | 3,258,063 | 3,258,063 |
| 9500 | 3,439,067 | 3,439,067 | 3,439,067 |
| 10000 | 3,620,070 | 3,620,070 | 3,620,070 |
Total Cost by Percent Mix and Plant Capacity
Total Cost of Logging Residue
| Percent Mix |
|---|
| Plant Capacity | 25 | 50 | 75 | 100 |
|---|
| Tons/day | $ per year |
|---|
| 1000 | $3,487,759 | $7,598,267 | $12,257,967 | $17,388,669 |
| 1500 | $3,490,924 | $12,257,967 | $17,388,669 | $28,735,847 |
| 2000 | $7,593,386 | $17,388,669 | $28,735,847 | $41,252,798 |
| 2500 | $9,863,826 | $22,914,192 | $38,002,405 | $54,959,061 |
| 3000 | $12,307,693 | $28,735,847 | $47,972,339 | $69,666,137 |
| 3500 | $14,775,198 | $34,851,198 | $58,557,984 | $85,337,327 |
| 4000 | $17,382,463 | $41,252,798 | $69,671,975 | $101,944,812 |
| 4500 | $20,103,934 | $47,972,339 | $81,324,635 | $119,385,933 |
| 5000 | $22,909,322 | $54,959,061 | $93,530,468 | $137,607,531 |
| 5500 | $25,787,534 | $62,225,766 | $106,243,816 | $156,508,085 |
| 6000 | $28,735,847 | $69,666,137 | $119,388,506 | $176,127,606 |
| 6500 | $31,752,784 | $77,369,241 | $132,980,819 | $196,483,934 |
| 7000 | $34,851,198 | $85,337,327 | $147,021,321 | $217,615,683 |
| 7500 | $38,002,405 | $93,530,468 | $161,356,652 | $239,568,697 |
| 8000 | $41,252,798 | $101,944,812 | $176,127,606 | $262,515,297 |
| 8500 | $44,571,676 | $110,567,653 | $191,320,814 | $286,910,993 |
| 9000 | $47,972,339 | $119,385,933 | $206,942,316 | $312,917,223 |
| 9500 | $51,430,771 | $128,398,512 | $223,008,302 | $340,713,897 |
| 10000 | $54,959,061 | $137,607,531 | $239,518,027 | $369,735,271 |
Total Cost of Switchgrass
| Percent Mix |
|---|
| Plant Capacity | 75 | 50 | 25 |
|---|
| Tons/day | $ per year |
|---|
| 1,000 | $18,818,632 | $12,439,707 | $6,150,111 |
| 1,500 | $28,512,454 | $18,818,632 | $9,304,710 |
| 2,000 | $38,351,069 | $25,374,266 | $12,439,707 |
| 2,500 | $48,091,105 | $31,841,515 | $15,665,515 |
| 3,000 | $58,034,335 | $38,351,069 | $18,818,632 |
| 3,500 | $68,045,043 | $44,802,927 | $22,010,330 |
| 4,000 | $78,039,783 | $51,381,556 | $25,374,266 |
| 4,500 | $88,341,141 | $58,034,335 | $28,512,454 |
| 5,000 | $98,582,053 | $64,737,016 | $31,841,515 |
| 5,500 | $108,902,572 | $71,496,585 | $34,990,970 |
| 6,000 | $119,270,955 | $78,039,783 | $38,351,069 |
| 6,500 | $129,636,014 | $84,854,248 | $41,561,469 |
| 7,000 | $140,154,226 | $91,610,222 | $44,802,927 |
| 7,500 | $150,832,540 | $98,582,053 | $48,091,105 |
| 8000 | $161,352,841 | $105,352,124 | $51,381,556 |
| 8500 | $172,012,417 | $112,233,980 | $54,908,384 |
| 9000 | $182,519,521 | $119,270,955 | $57,944,070 |
| 9500 | $193,565,455 | $126,101,641 | $61,322,168 |
| 10000 | $204,605,696 | $133,231,242 | $64,737,016 |
Total Cost of Feedstock
| Percent Mix |
|---|
| Plant Capacity | 25% Pine | 50% Pine | 75% Pine |
|---|
| Tons/day | $ per year |
|---|
| 1,000 | $22,306,391 | $20,037,974 | $18,408,078 |
| 1,500 | $32,003,378 | $31,076,599 | $26,693,379 |
| 2,000 | $45,944,455 | $42,762,935 | $41,175,554 |
| 2,500 | $57,954,931 | $54,755,707 | $53,667,920 |
| 3,000 | $70,342,028 | $67,086,916 | $66,790,971 |
| 3,500 | $82,820,241 | $79,654,125 | $80,568,314 |
| 4,000 | $95,422,246 | $92,634,354 | $95,046,241 |
| 4,500 | $108,445,075 | $106,006,674 | $109,837,089 |
| 5,000 | $121,491,375 | $119,696,077 | $125,371,983 |
| 5,500 | $134,690,106 | $133,722,351 | $141,234,786 |
| 6,000 | $148,006,802 | $147,705,920 | $157,739,575 |
| 6,500 | $161,388,798 | $162,223,489 | $174,542,288 |
| 7,000 | $175,005,424 | $176,947,549 | $191,824,248 |
| 7,500 | $188,834,945 | $192,112,521 | $209,447,757 |
| 8000 | $202,605,639 | $207,296,936 | $227,509,162 |
| 8500 | $216,584,093 | $222,801,633 | $246,229,198 |
| 9000 | $230,491,860 | $238,656,888 | $264,886,386 |
| 9500 | $244,996,226 | $254,500,153 | $284,330,470 |
| 10000 | $259,564,757 | $270,838,773 | $304,255,043 |
Transportation Cost by Percent Mix and Plant Capacity
Transportation Cost of Logging Residue
| Percent Mix |
|---|
| Plant Capacity | 25 | 50 | 75 | 100 |
|---|
| Tons/day | $ per year |
|---|
| 1000 | $682,455 | $1,985,967 | $3,840,405 | $6,163,281 |
| 1500 | $683,451 | $3,840,405 | $6,163,281 | $11,901,293 |
| 2000 | $1,984,189 | $6,163,281 | $11,901,293 | $18,804,445 |
| 2500 | $2,852,008 | $8,884,611 | $16,959,428 | $26,903,330 |
| 3000 | $3,861,686 | $11,901,293 | $22,718,558 | $35,999,185 |
| 3500 | $4,949,903 | $15,204,966 | $29,096,253 | $46,055,957 |
| 4000 | $6,160,334 | $18,804,445 | $36,002,864 | $57,053,877 |
| 4500 | $7,479,537 | $22,718,558 | $43,446,950 | $68,885,821 |
| 5000 | $8,882,146 | $26,903,330 | $51,443,506 | $81,491,527 |
| 5500 | $10,357,030 | $31,353,970 | $59,945,892 | $94,784,279 |
| 6000 | $11,901,293 | $35,999,185 | $68,887,585 | $108,790,133 |
| 6500 | $13,514,275 | $40,896,515 | $78,270,038 | $123,538,898 |
| 7000 | $15,204,966 | $46,055,957 | $88,086,322 | $139,055,133 |
| 7500 | $16,959,428 | $51,443,506 | $98,226,254 | $155,389,547 |
| 8000 | $18,804,445 | $57,053,877 | $108,790,133 | $172,735,700 |
| 8500 | $20,722,122 | $62,871,438 | $119,777,955 | $191,521,904 |
| 9000 | $22,718,558 | $68,885,821 | $131,193,714 | $211,917,206 |
| 9500 | $24,776,870 | $75,092,655 | $143,046,573 | $234,101,061 |
| 10000 | $26,903,330 | $81,491,527 | $155,351,588 | $257,504,228 |
Transportation Cost of Switchgrass
| Percent Mix |
|---|
| Plant Capacity | 75 | 50 | 25 |
|---|
| Tons/day | $ per year |
|---|
| 1,000 | $3,563,600 | $2,253,199 | $1,045,424 |
| 1,500 | $5,656,720 | $3,563,600 | $1,637,465 |
| 2,000 | $7,802,897 | $4,967,032 | $2,253,199 |
| 2,500 | $10,014,074 | $6,381,613 | $2,908,875 |
| 3,000 | $12,342,113 | $7,802,897 | $3,563,600 |
| 3,500 | $14,727,391 | $9,249,324 | $4,238,746 |
| 4,000 | $17,179,589 | $10,767,508 | $4,967,032 |
| 4,500 | $19,742,715 | $12,342,113 | $5,656,720 |
| 5,000 | $22,348,918 | $13,928,738 | $6,381,613 |
| 5,500 | $24,997,803 | $15,561,441 | $7,064,600 |
| 6,000 | $27,729,807 | $17,179,589 | $7,802,897 |
| 6,500 | $30,491,881 | $18,868,480 | $8,532,726 |
| 7,000 | $33,426,742 | $20,582,954 | $9,249,324 |
| 7,500 | $36,406,868 | $22,348,918 | $10,014,074 |
| 8000 | $39,342,091 | $24,075,652 | $10,767,508 |
| 8500 | $42,334,228 | $25,866,228 | $11,604,403 |
| 9000 | $45,244,541 | $27,729,807 | $12,323,455 |
| 9500 | $48,334,892 | $29,526,542 | $13,098,659 |
| 10000 | $51,393,912 | $31,505,732 | $13,928,738 |
Transportation Cost of Feedstock
| Percent Mix |
|---|
| Plant Capacity | 25% Pine | 50% Pine | 75% Pine |
|---|
| Tons/day | $ per year |
|---|
| 1,000 | 4,246,055 | 4,239,166 | 4,885,829 |
| 1,500 | 6,340,171 | 7,404,005 | 7,800,746 |
| 2,000 | 9,787,086 | 11,130,313 | 14,154,492 |
| 2,500 | 12,866,082 | 15,266,224 | 19,868,303 |
| 3,000 | 16,203,799 | 19,704,190 | 26,282,158 |
| 3,500 | 19,677,294 | 24,454,290 | 33,334,999 |
| 4,000 | 23,339,923 | 29,571,953 | 40,969,896 |
| 4,500 | 27,222,252 | 35,060,671 | 49,103,670 |
| 5,000 | 31,231,064 | 40,832,068 | 57,825,119 |
| 5,500 | 35,354,833 | 46,915,411 | 67,010,492 |
| 6,000 | 39,631,100 | 53,178,774 | 76,690,482 |
| 6,500 | 44,006,156 | 59,764,995 | 86,802,764 |
| 7,000 | 48,631,708 | 66,638,911 | 97,335,646 |
| 7,500 | 53,366,296 | 73,792,424 | 108,240,328 |
| 8000 | 58,146,536 | 81,129,529 | 119,557,641 |
| 8500 | 63,056,350 | 88,737,666 | 131,382,358 |
| 9000 | 67,963,099 | 96,615,628 | 143,517,169 |
| 9500 | 73,111,762 | 104,619,197 | 156,145,232 |
| 10000 | 78,297,242 | 112,997,259 | 169,280,326 |
Total Distance Traveled by Percent Mix and Plant Capacity
Total Distance Traveled by Logging Residue
| Percent Mix |
|---|
| Plant Capacity | 25 | 50 | 75 | 100 |
|---|
| Tons/day | Ton-miles per year |
|---|
| 1000 | 2,201,467 | 6,406,345 | 12,388,405 | 19,881,553 |
| 1500 | 2,204,680 | 12,388,405 | 19,881,553 | 38,391,269 |
| 2000 | 6,400,610 | 19,881,553 | 38,391,269 | 60,659,501 |
| 2500 | 9,200,025 | 28,660,037 | 54,707,832 | 86,784,936 |
| 3000 | 12,457,050 | 38,391,269 | 73,285,670 | 116,126,404 |
| 3500 | 15,967,430 | 49,048,279 | 93,858,881 | 148,567,602 |
| 4000 | 19,872,045 | 60,659,501 | 116,138,271 | 184,044,766 |
| 4500 | 24,127,539 | 73,285,670 | 140,151,450 | 222,212,327 |
| 5000 | 28,652,084 | 86,784,936 | 165,946,793 | 262,875,894 |
| 5500 | 33,409,773 | 101,141,839 | 193,373,844 | 305,755,737 |
| 6000 | 38,391,269 | 116,126,404 | 222,218,015 | 350,935,912 |
| 6500 | 43,594,434 | 131,924,243 | 252,483,992 | 398,512,573 |
| 7000 | 49,048,279 | 148,567,602 | 284,149,426 | 448,564,945 |
| 7500 | 54,707,832 | 165,946,793 | 316,858,884 | 501,256,604 |
| 8000 | 60,659,501 | 184,044,766 | 350,935,912 | 557,211,934 |
| 8500 | 66,845,554 | 202,811,090 | 386,380,500 | 617,812,593 |
| 9000 | 73,285,670 | 222,212,327 | 423,205,530 | 683,603,890 |
| 9500 | 79,925,386 | 242,234,370 | 461,440,557 | 755,164,714 |
| 10000 | 86,784,936 | 262,875,894 | 501,134,155 | 830,658,800 |
Total Distance Traveled by Switchgrass
| Percent Mix |
|---|
| Plant Capacity | 75 | 50 | 25 |
|---|
| Tons/day | Ton-miles per year |
|---|
| 1,000 | 4,436,445 | 2,412,579 | 860,220 |
| 1,500 | 8,008,103 | 4,436,445 | 1,569,254 |
| 2,000 | 11,792,765 | 6,788,695 | 2,412,579 |
| 2,500 | 15,989,681 | 9,275,180 | 3,400,363 |
| 3,000 | 20,629,052 | 11,792,765 | 4,436,445 |
| 3,500 | 25,550,280 | 14,481,165 | 5,534,976 |
| 4,000 | 30,827,549 | 17,443,615 | 6,788,695 |
| 4,500 | 36,477,340 | 20,629,052 | 8,008,103 |
| 5,000 | 42,395,571 | 23,867,856 | 9,275,180 |
| 5,500 | 48,505,242 | 27,310,102 | 10,469,787 |
| 6,000 | 55,010,959 | 30,827,549 | 11,792,765 |
| 6,500 | 61,682,384 | 34,530,456 | 13,179,307 |
| 7,000 | 69,097,464 | 38,400,677 | 14,481,165 |
| 7,500 | 76,671,978 | 42,395,571 | 15,989,681 |
| 8000 | 84,141,302 | 46,343,304 | 17,443,615 |
| 8500 | 91,827,316 | 50,547,703 | 19,139,578 |
| 9000 | 99,242,956 | 55,010,959 | 20,598,119 |
| 9500 | 107,197,984 | 59,292,327 | 22,118,951 |
| 10000 | 115,031,734 | 64,258,898 | 23,867,856 |
Total Distance Traveled by Feedstock
| Percent Mix |
|---|
| Plant Capacity | 25% Pine | 50% Pine | 75% Pine |
|---|
| Tons/day | Ton-miles per year |
|---|
| 1,000 | 6,637,912 | 8,818,924 | 13,248,625 |
| 1,500 | 10,212,782 | 16,824,850 | 21,450,807 |
| 2,000 | 18,193,375 | 26,670,248 | 40,803,849 |
| 2,500 | 25,189,706 | 37,935,217 | 58,108,195 |
| 3,000 | 33,086,102 | 50,184,035 | 77,722,115 |
| 3,500 | 41,517,710 | 63,529,444 | 99,393,858 |
| 4,000 | 50,699,594 | 78,103,116 | 122,926,966 |
| 4,500 | 60,604,879 | 93,914,722 | 148,159,553 |
| 5,000 | 71,047,655 | 110,652,792 | 175,221,973 |
| 5,500 | 81,915,015 | 128,451,941 | 203,843,631 |
| 6,000 | 93,402,228 | 146,953,954 | 234,010,780 |
| 6,500 | 105,276,818 | 166,454,699 | 265,663,300 |
| 7,000 | 118,145,743 | 186,968,279 | 298,630,591 |
| 7,500 | 131,379,810 | 208,342,364 | 332,848,565 |
| 8000 | 144,800,803 | 230,388,070 | 368,379,528 |
| 8500 | 158,672,870 | 253,358,793 | 405,520,079 |
| 9000 | 172,528,627 | 277,223,286 | 443,803,648 |
| 9500 | 187,123,370 | 301,526,697 | 483,559,507 |
| 10000 | 201,816,670 | 327,134,791 | 525,002,011 |
Average Distance Traveled by a Ton by Percent Mix and Plant Capacity
Average Distance Traveled by a Ton of Logging Residue
| Percent Mix |
|---|
| Plant Capacity | 25 | 50 | 75 | 100 |
|---|
| Tons/day | Miles per ton |
|---|
| 1000 | 24 | 35 | 46 | 55 |
| 1500 | 16 | 46 | 55 | 71 |
| 2000 | 35 | 55 | 71 | 84 |
| 2500 | 41 | 63 | 81 | 96 |
| 3000 | 46 | 71 | 90 | 107 |
| 3500 | 50 | 77 | 99 | 117 |
| 4000 | 55 | 84 | 107 | 127 |
| 4500 | 59 | 90 | 115 | 136 |
| 5000 | 63 | 96 | 122 | 145 |
| 5500 | 67 | 102 | 129 | 154 |
| 6000 | 71 | 107 | 136 | 162 |
| 6500 | 74 | 112 | 143 | 169 |
| 7000 | 77 | 117 | 149 | 177 |
| 7500 | 81 | 122 | 156 | 185 |
| 8000 | 84 | 127 | 162 | 192 |
| 8500 | 87 | 132 | 167 | 201 |
| 9000 | 90 | 136 | 173 | 210 |
| 9500 | 93 | 141 | 179 | 220 |
| 10000 | 96 | 145 | 185 | 229 |
Average Distance Traveled by a Ton of Switchgrass
| Percent Mix |
|---|
| Plant Capacity | 75 | 50 | 25 |
|---|
| Tons/day | Miles per ton |
|---|
| 1,000 | 16 | 13 | 9 |
| 1,500 | 20 | 16 | 11 |
| 2,000 | 22 | 19 | 13 |
| 2,500 | 24 | 20 | 15 |
| 3,000 | 25 | 22 | 16 |
| 3,500 | 27 | 23 | 17 |
| 4,000 | 28 | 24 | 19 |
| 4,500 | 30 | 25 | 20 |
| 5,000 | 31 | 26 | 20 |
| 5,500 | 32 | 27 | 21 |
| 6,000 | 34 | 28 | 22 |
| 6,500 | 35 | 29 | 22 |
| 7,000 | 36 | 30 | 23 |
| 7,500 | 38 | 31 | 24 |
| 8000 | 39 | 32 | 24 |
| 8500 | 40 | 33 | 25 |
| 9000 | 41 | 34 | 25 |
| 9500 | 42 | 34 | 26 |
| 10000 | 42 | 35 | 26 |
Average Distance Traveled by a Ton of Feedstock
| Percent Mix |
|---|
| Plant Capacity | 25% Pine | 50% Pine | 75% Pine |
|---|
| Tons/day | Miles per ton |
|---|
| 1,000 | 18 | 24 | 37 |
| 1,500 | 19 | 31 | 40 |
| 2,000 | 25 | 37 | 56 |
| 2,500 | 28 | 42 | 64 |
| 3,000 | 30 | 46 | 72 |
| 3,500 | 33 | 50 | 78 |
| 4,000 | 35 | 54 | 85 |
| 4,500 | 37 | 58 | 91 |
| 5,000 | 39 | 61 | 97 |
| 5,500 | 41 | 65 | 102 |
| 6,000 | 43 | 68 | 108 |
| 6,500 | 45 | 71 | 113 |
| 7,000 | 47 | 74 | 118 |
| 7,500 | 48 | 77 | 123 |
| 8000 | 50 | 80 | 127 |
| 8500 | 52 | 82 | 132 |
| 9000 | 53 | 85 | 136 |
| 9500 | 54 | 88 | 141 |
| 10000 | 56 | 90 | 145 |
100% Pine
100% Pine
| Plant Capacity | Quantity | Total Cost | Tranport Cost | FarmGate Cost | Average Distance |
|---|
| Tons/day | Dry Short Tons | Dollars | Miles/st |
|---|
| 1,000 | 362,007 | $17,388,669 | $6,163,281 | $11,225,388 | 55 |
| 1,500 | 543,011 | $28,735,847 | $11,901,293 | $16,834,553 | 71 |
| 2,000 | 724,014 | $41,252,798 | $18,804,445 | $22,448,353 | 84 |
| 2,500 | 905,018 | $54,959,061 | $26,903,330 | $28,055,731 | 96 |
| 3,000 | 1,086,021 | $69,666,137 | $35,999,185 | $33,666,952 | 107 |
| 3,500 | 1,267,025 | $85,337,327 | $46,055,957 | $39,281,370 | 117 |
| 4,000 | 1,448,028 | $101,944,812 | $57,053,877 | $44,890,935 | 127 |
| 4,500 | 1,629,032 | $119,385,933 | $68,885,821 | $50,500,112 | 136 |
| 5,000 | 1,810,035 | $137,607,531 | $81,491,527 | $56,116,004 | 145 |
| 5,500 | 1,991,039 | $156,508,085 | $94,784,279 | $61,723,806 | 154 |
| 6,000 | 2,172,042 | $176,127,606 | $108,790,133 | $67,337,473 | 162 |
| 6,500 | 2,353,046 | $196,483,934 | $123,538,898 | $72,945,036 | 169 |
| 7,000 | 2,534,049 | $217,615,683 | $139,055,133 | $78,560,551 | 177 |
| 7,500 | 2,715,053 | $239,568,697 | $155,389,547 | $84,179,150 | 185 |
| 8,000 | 2,896,056 | $262,515,297 | $172,735,700 | $89,779,597 | 192 |
| 8,500 | 3,077,060 | $286,910,993 | $191,521,904 | $95,389,089 | 201 |
| 9,000 | 3,258,063 | $312,917,223 | $211,917,206 | $101,000,017 | 210 |
| 9,500 | 3,439,067 | $340,713,897 | $234,101,061 | $106,612,836 | 220 |
| 10,000 | 3,620,070 | $369,735,271 | $257,504,228 | $112,231,043 | 229 |
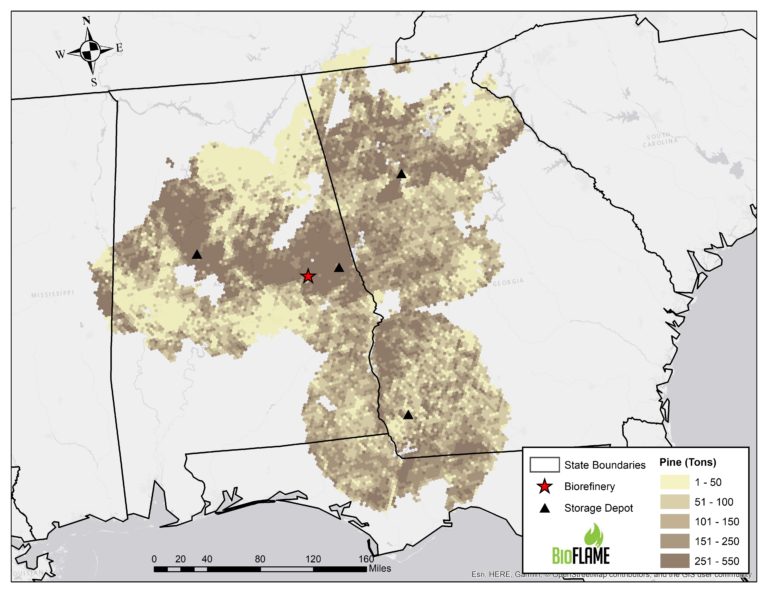
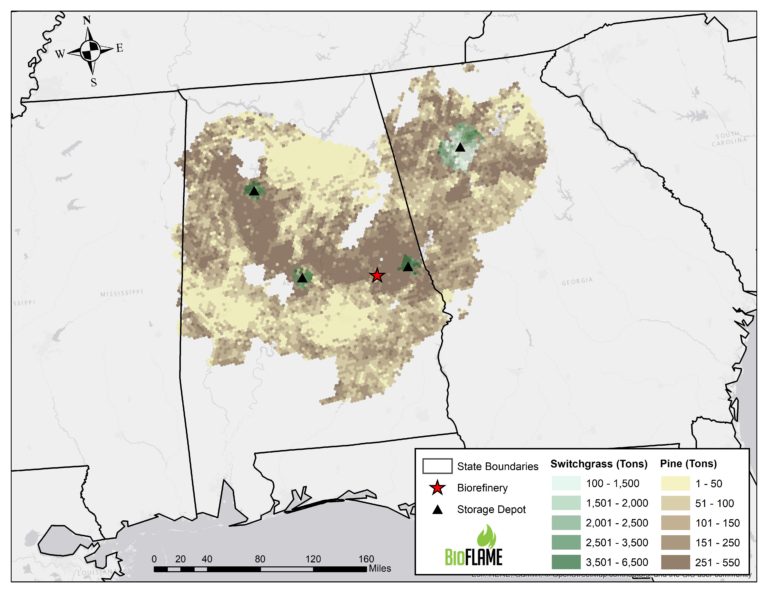
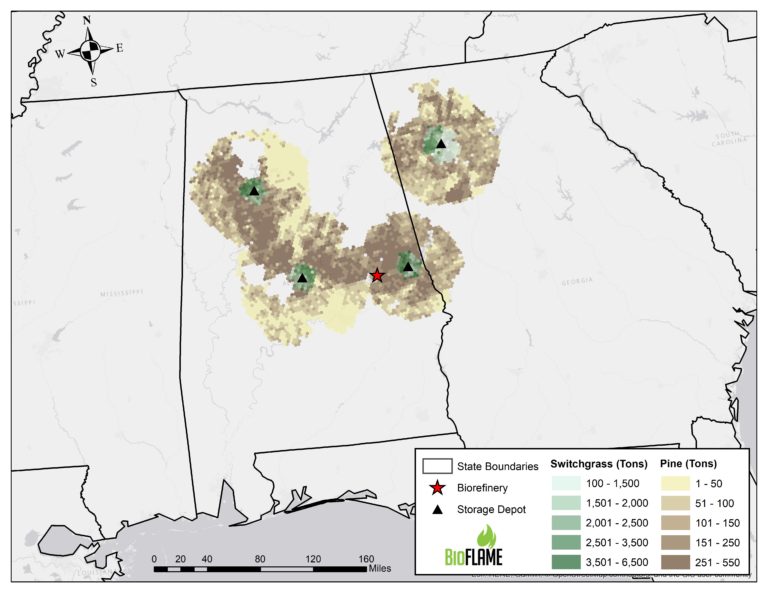
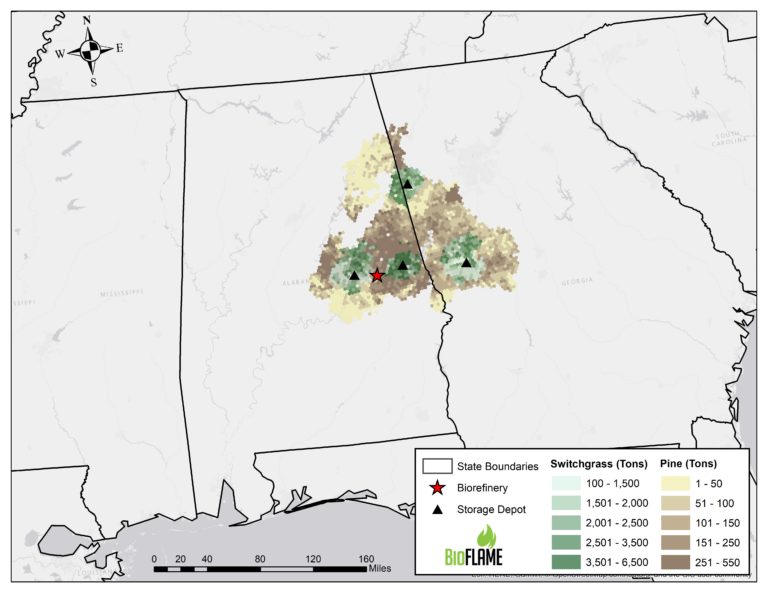
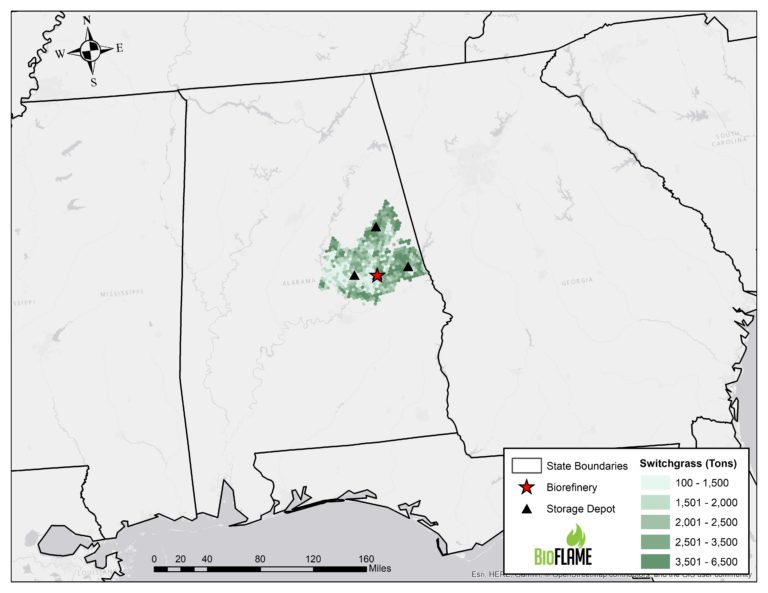
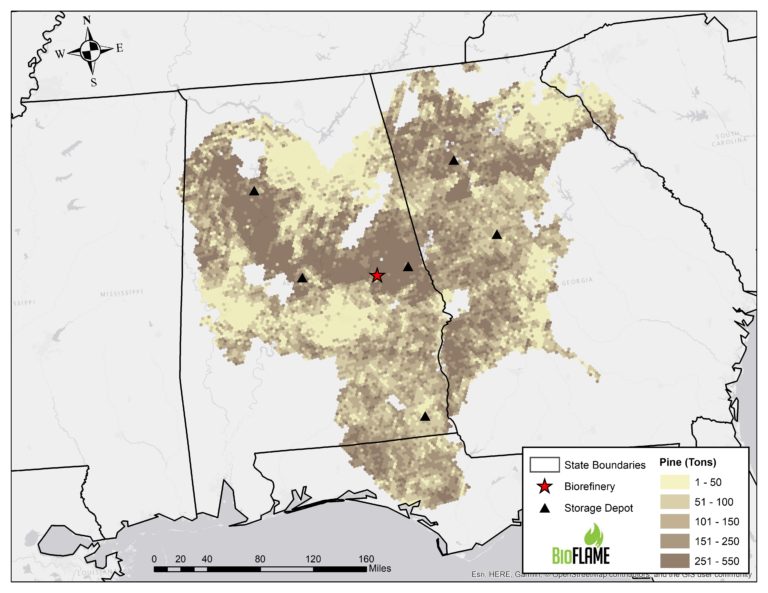
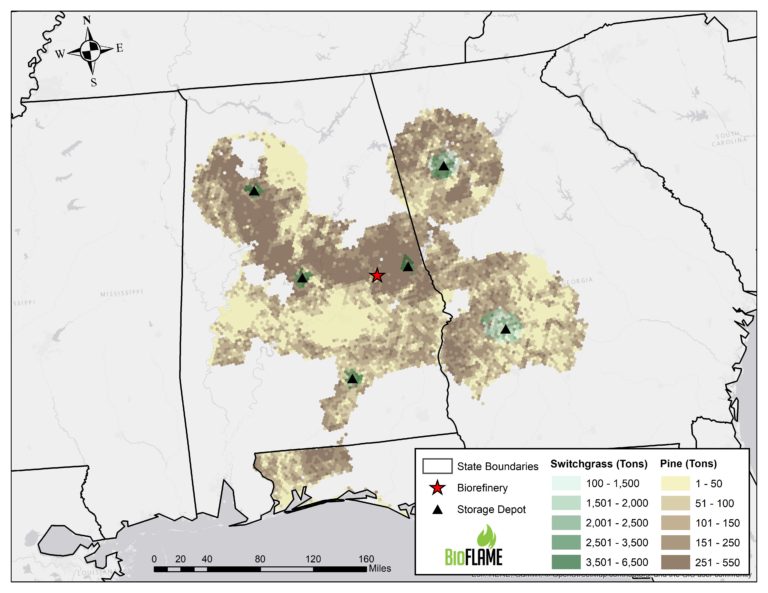
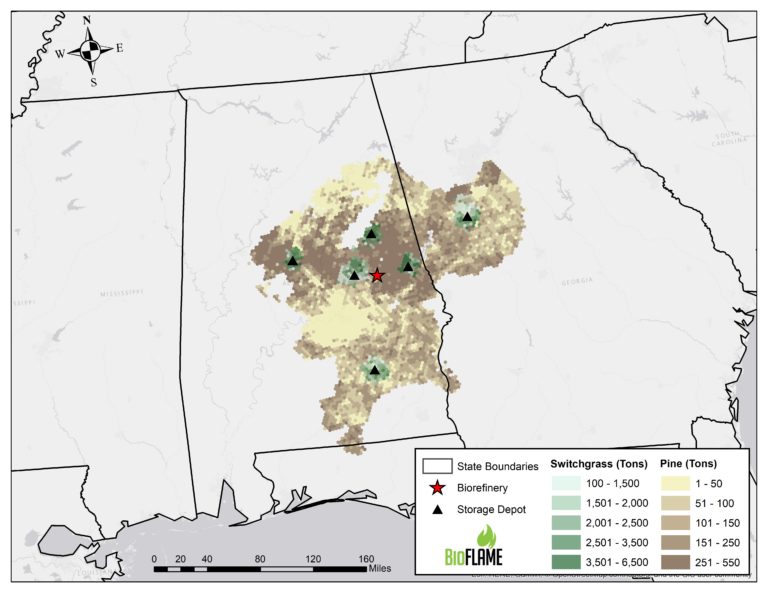
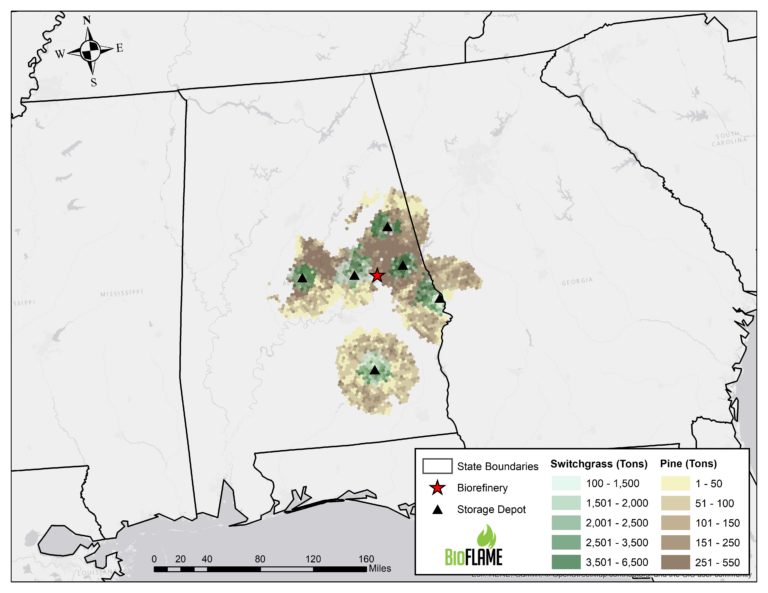
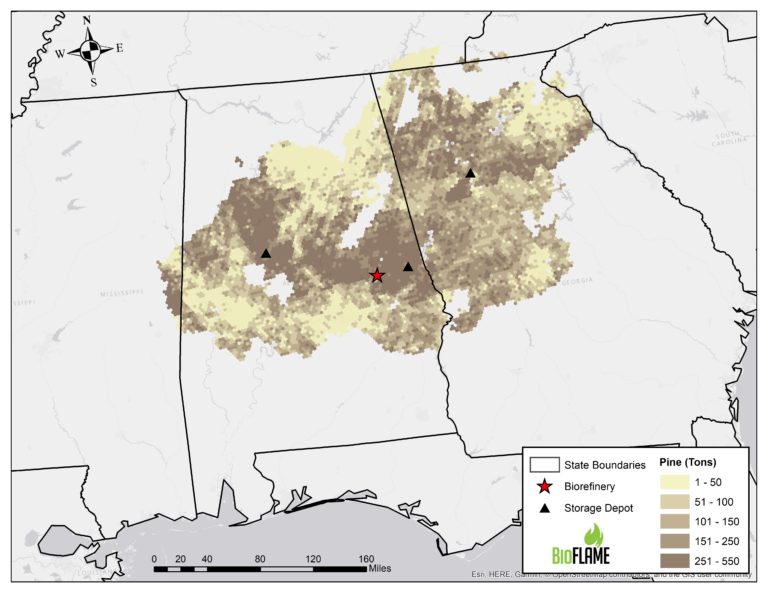
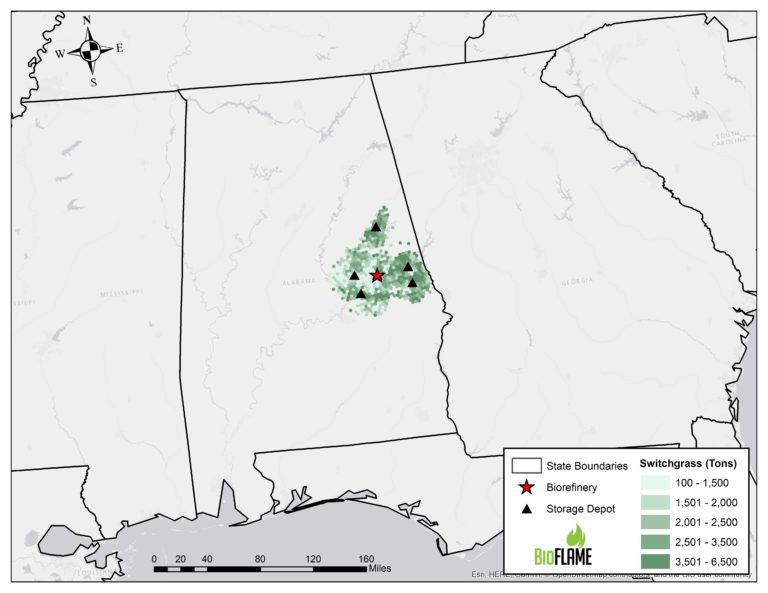
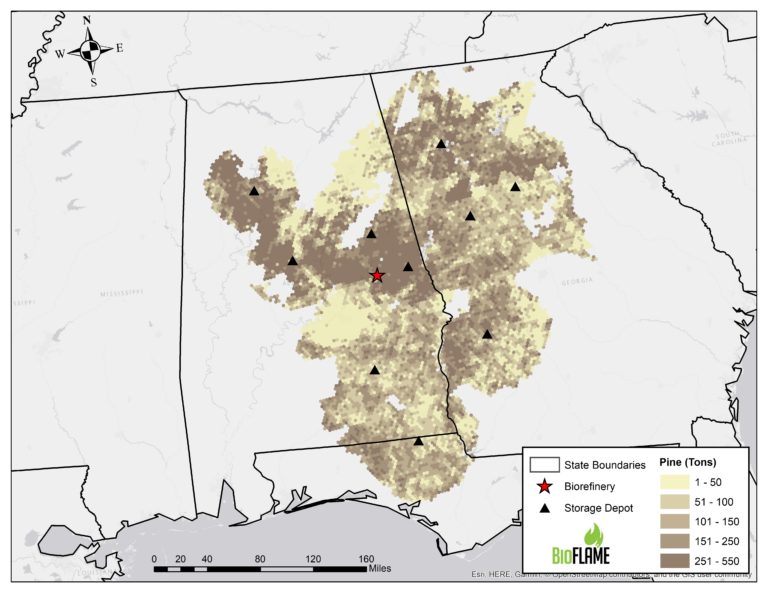
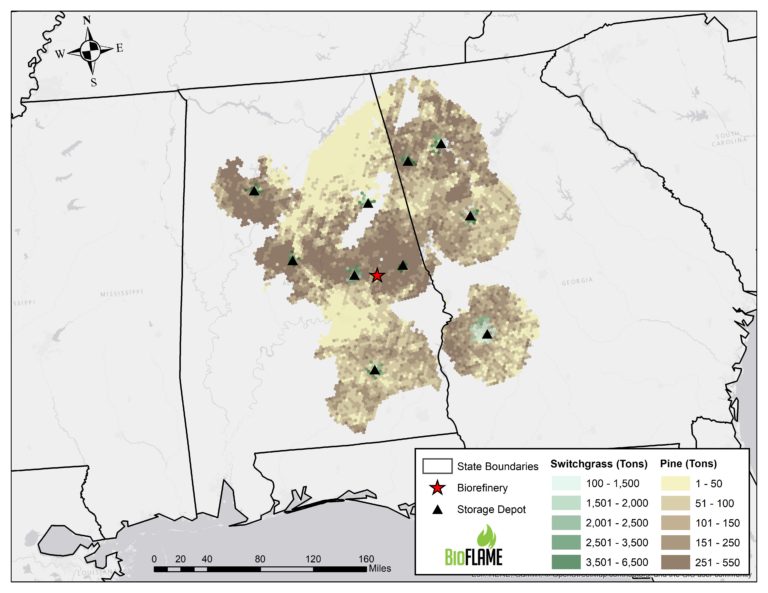
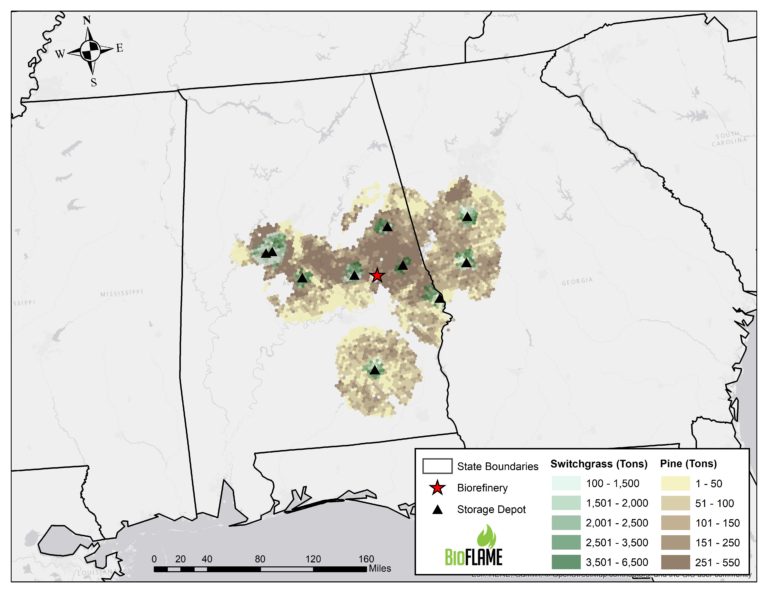
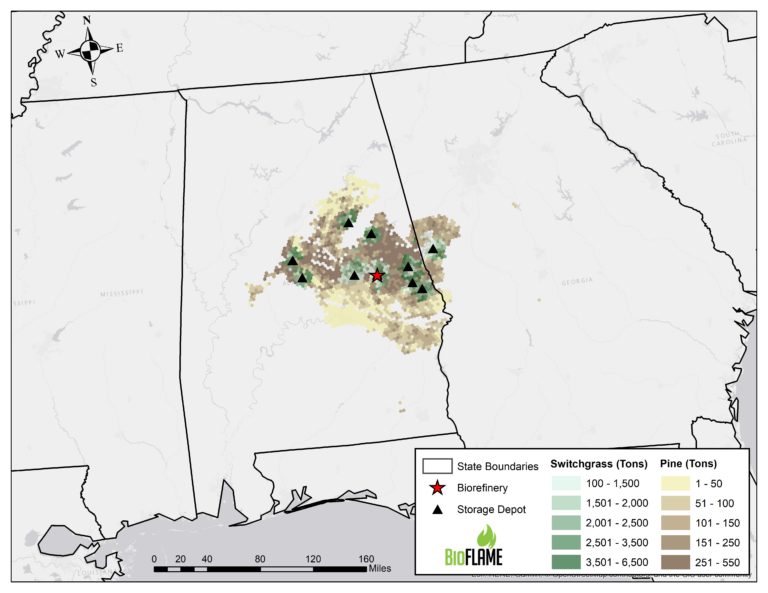
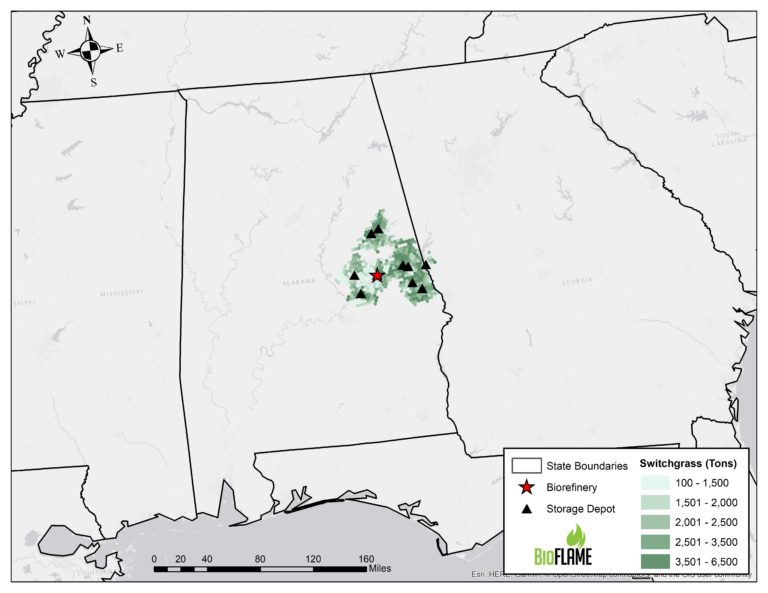
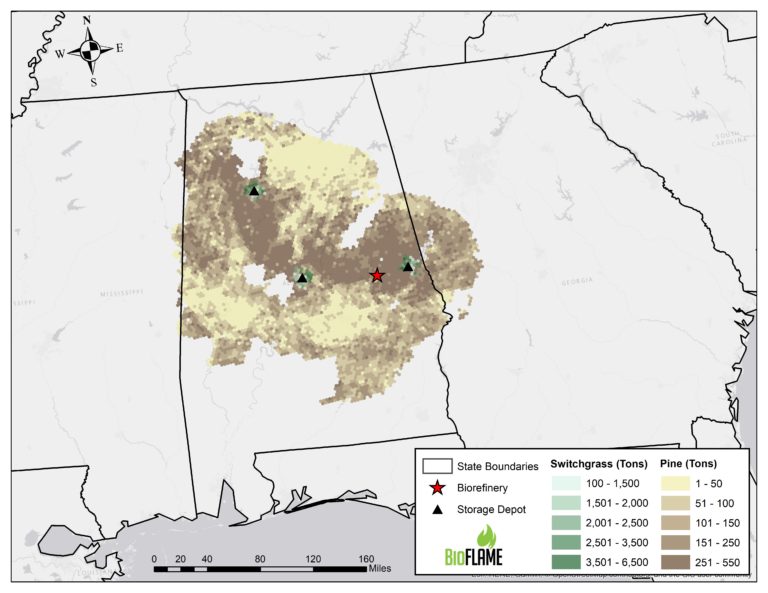
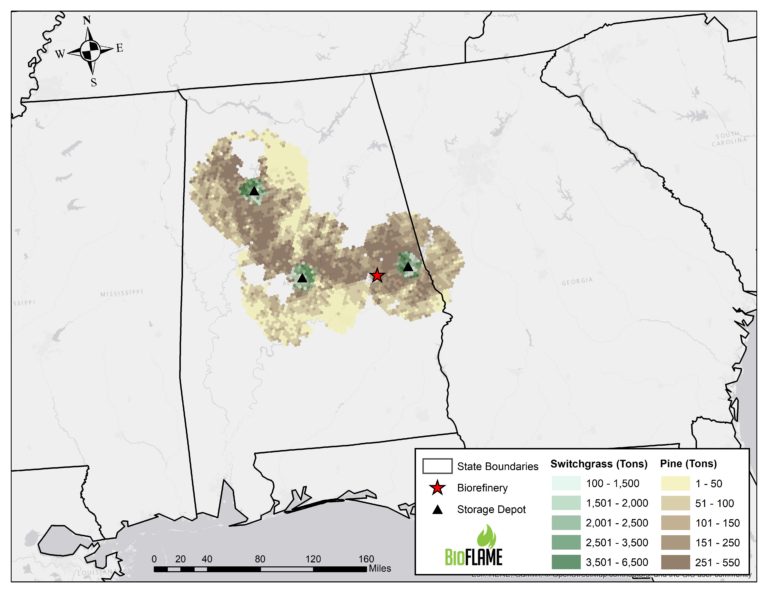
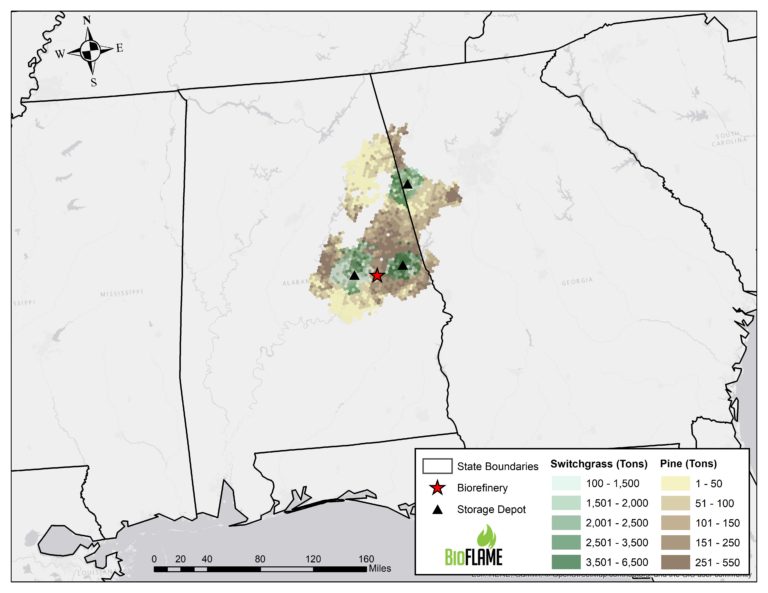
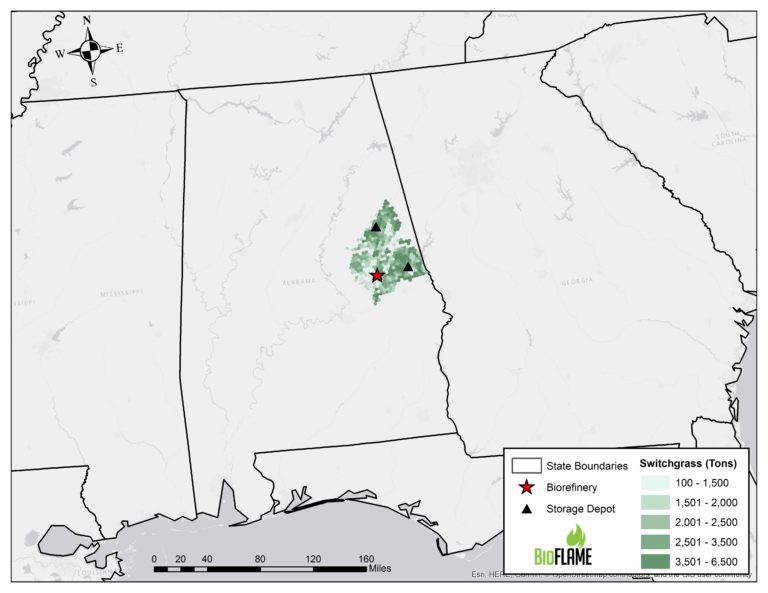
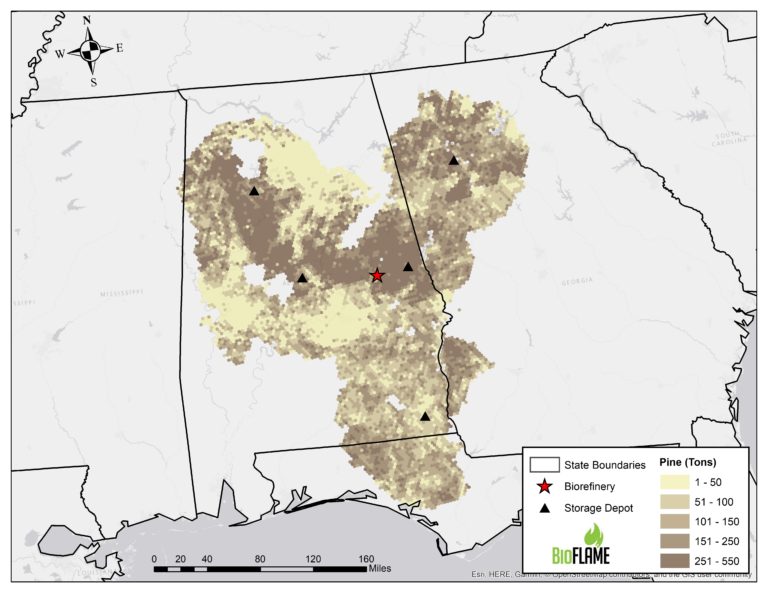
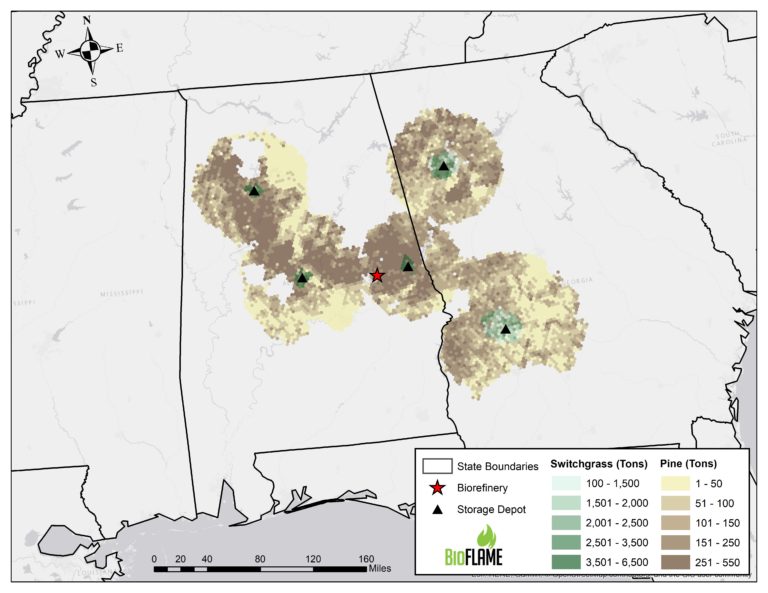
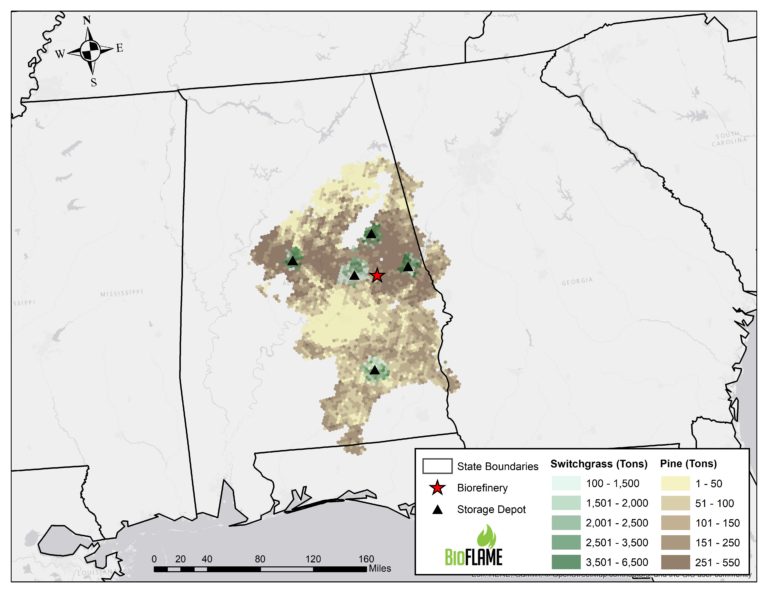
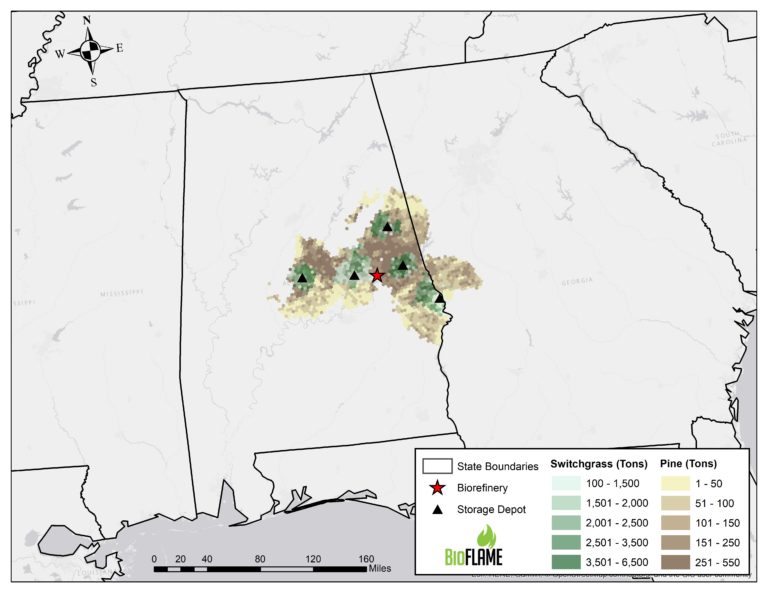
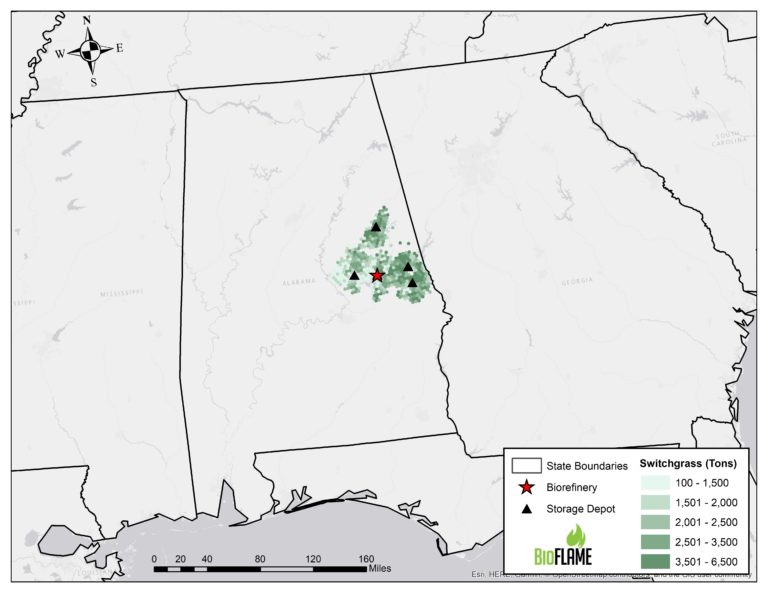
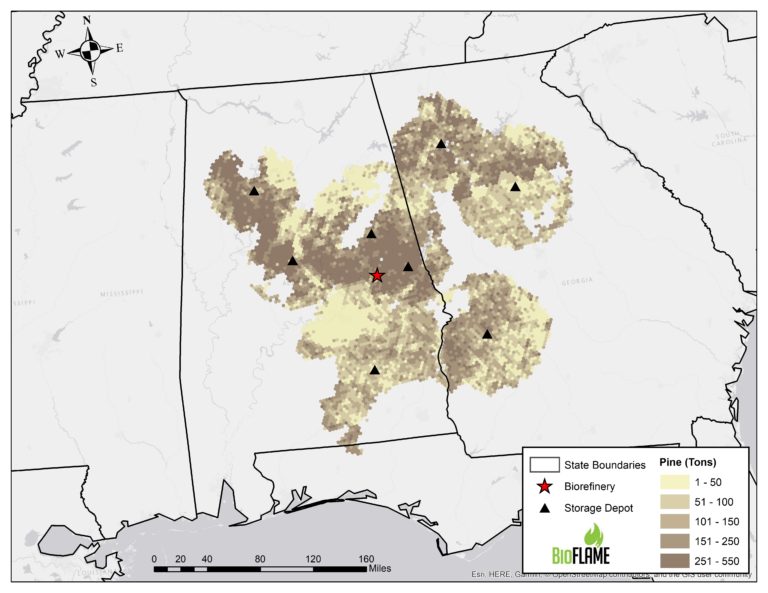
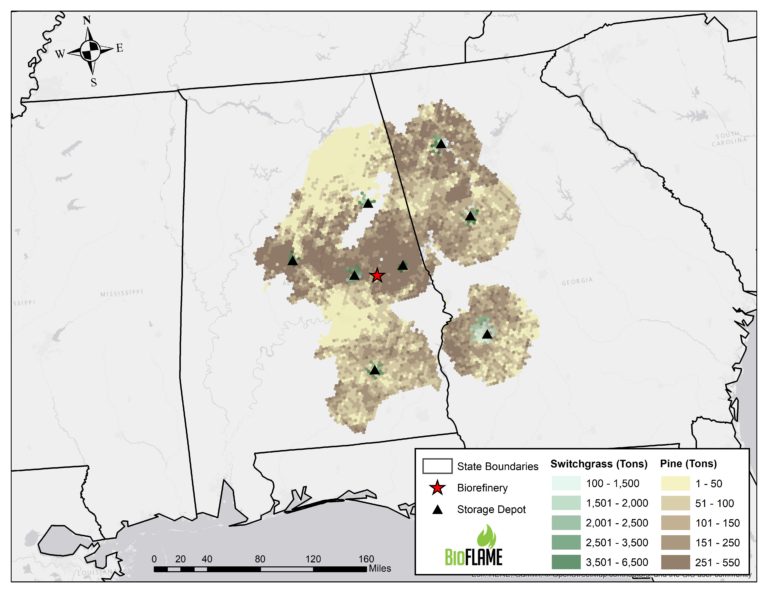
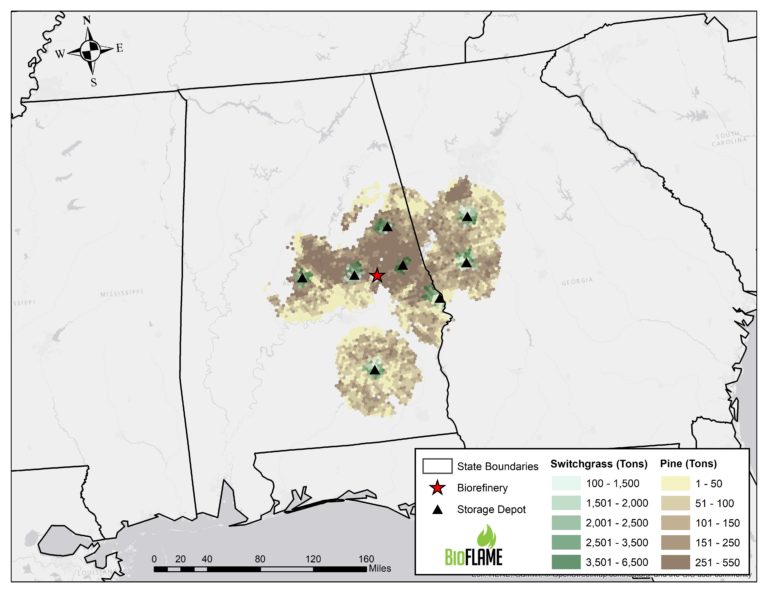
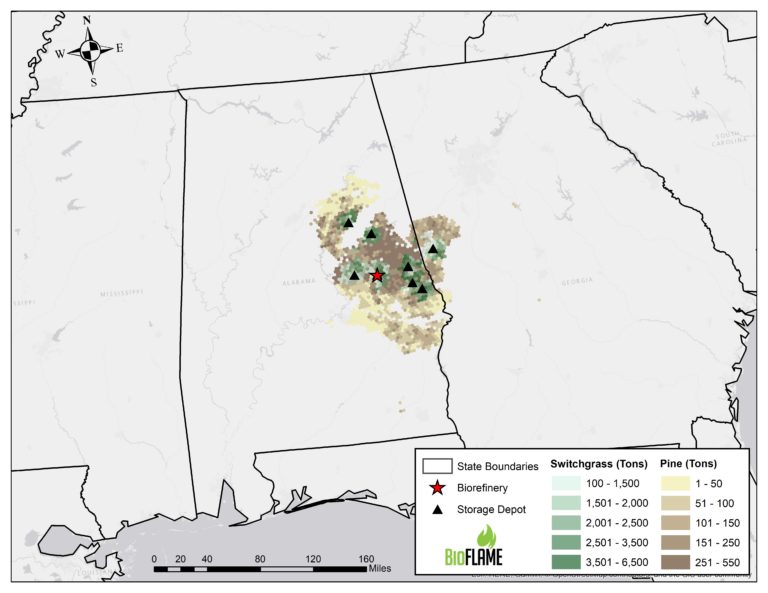
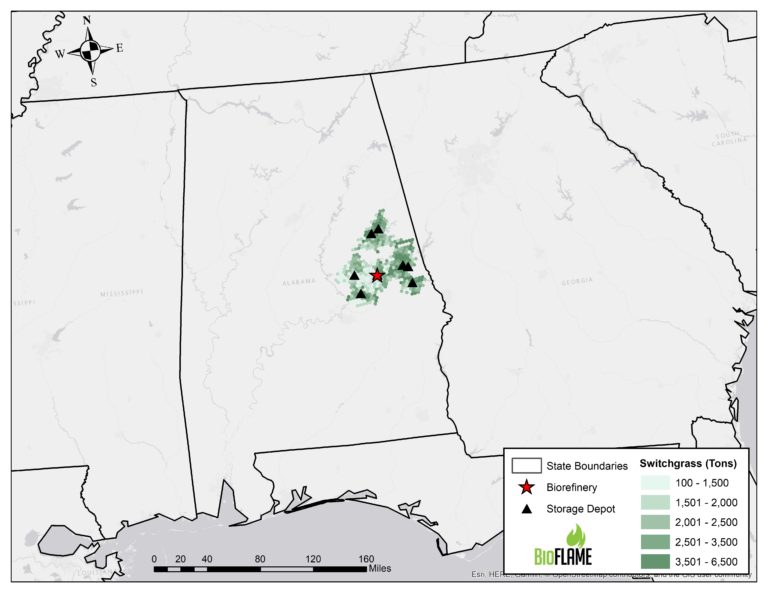
Biorefinery Capacity: 900,000 tons, Depot Size: 285,000 tons, Composition: 100% Pine Biorefinery Capacity: 900,000 tons, Depot Size: 285,000 tons, Composition: 75% Pine and 25% Switchgrass Biorefinery Capacity: 900,000 tons, Depot Size: 285,000 tons, Composition: 50% Pine and 50% Switchgrass Biorefinery Capacity: 900,000 tons, Depot Size: 285,000 tons, Composition: 25% Pine and 75% Switchgrass Biorefinery Capacity: 900,000 tons, Depot Size: 285,000 tons, Composition: 100% Switchgrass Biorefinery Capacity: 900,000 tons, Depot Size: 185,000 tons, Composition: 100% Pine Biorefinery Capacity: 900,000 tons, Depot Size: 185,000 tons, Composition: 75% Pine and 25% Switchgrass Biorefinery Capacity: 900,000 tons, Depot Size: 185,000 tons, Composition: 50% Pine and 50% Switchgrass Biorefinery Capacity: 900,000 tons, Depot Size: 185,000 tons, Composition: 25% Pine and 75% Switchgrass Biorefinery Capacity: 725,000 tons, Depot Size: 285,000 tons, Composition: 100% Pine Biorefinery Capacity: 900,000 tons, Depot Size: 185,000 tons, Composition: 100% Switchgrass Biorefinery Capacity: 900,000 tons, Depot Size: 100,000 tons, Composition: 100% Pine Biorefinery Capacity: 900,000 tons, Depot Size: 100,000 tons, Composition: 75% Pine and 25% Switchgrass Biorefinery Capacity: 900,000 tons, Depot Size: 100,000 tons, Composition: 50% Pine and 50% Switchgrass Biorefinery Capacity: 900,000 tons, Depot Size: 100,000 tons, Composition: 25% Pine and 75% Switchgrass Biorefinery Capacity: 900,000 tons, Depot Size: 100,000 tons, Composition: 100% Switchgrass Biorefinery Capacity: 725,000 tons, Depot Size: 285,000 tons, Composition: 75% Pine and 25% Switchgrass Biorefinery Capacity: 725,000 tons, Depot Size: 285,000 tons, Composition: 50% Pine and 50% Switchgrass Biorefinery Capacity: 725,000 tons, Depot Size: 285,000 tons, Composition: 25% Pine and 75% Switchgrass Biorefinery Capacity: 725,000 tons, Depot Size: 285,000 tons, Composition: 100% Switchgrass Biorefinery Capacity: 725,000 tons, Depot Size: 185,000 tons, Composition: 100% Pine Biorefinery Capacity: 725,000 tons, Depot Size: 185,000 tons, Composition: 75% Pine and 25% Switchgrass Biorefinery Capacity: 725,000 tons, Depot Size: 185,000 tons, Composition: 50% Pine and 50% Switchgrass Biorefinery Capacity: 725,000 tons, Depot Size: 185,000 tons, Composition: 25% Pine and 75% Switchgrass Biorefinery Capacity: 725,000 tons, Depot Size: 185,000 tons, Composition: 100% Switchgrass Biorefinery Capacity: 725,000 tons, Depot Size: 100,000 tons, Composition: 100% Pine Biorefinery Capacity: 725,000 tons, Depot Size: 100,000 tons, Composition: 75% Pine and 25% Switchgrass Biorefinery Capacity: 725,000 tons, Depot Size: 100,000 tons, Composition: 50% Pine and 50% Switchgrass Biorefinery Capacity: 725,000 tons, Depot Size: 100,000 tons, Composition: 25% Pine and 75% Switchgrass Biorefinery Capacity: 725,000 tons, Depot Size: 100,000 tons, Composition: 100% Switchgrass