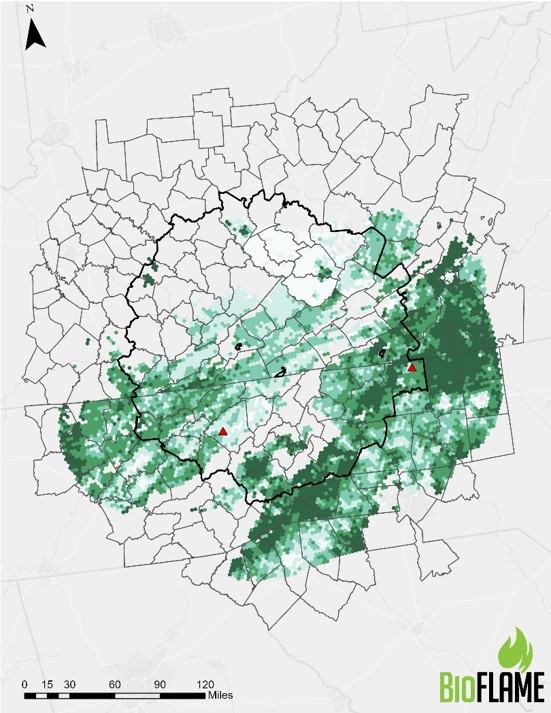
Quantity of Forest Residues Supplied to the Biorefineries by BEA region
BEA
Surry
Greene
Total
Tons
10
78,491
153,039
231,529
29
34,810
10,028
44,838
31
67,958
29,896
97,854
66
343,270
343,270
68
1,109
115,526
116,635
81
20,132
133,325
153,457
88
214,463
214,463
94
56,164
56,164
116
12,445
12,445
138
179,496
179,496
Total
725,267
724,885
1,450,152
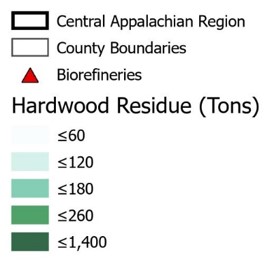
Cost of Delivered Forest Residues Supplied to the Biorefineries by BEA region
BEA
Surry
Greene
Total
Dollars
10
$5,259,246
$10,384,914
$15,644,160
29
$2,392,555
$870,049
$3,262,604
31
$4,487,426
$2,650,073
$7,137,499
66
$18,693,823
$18,693,823
68
$80,181
$8,879,189
$8,959,370
81
$1,345,665
$9,153,332
$10,498,997
88
$16,216,596
$16,216,596
94
$4,977,877
$4,977,877
116
$1,006,450
$1,006,450
138
$10,875,068
$10,875,068
Total
$43,133,964
$54,138,480
$97,272,444
Cost to Transport forest residues to biorefinery
BEA
Surry
Greene
Total
Dollars
10
$2,029,210
$4,212,953
$6,242,164
29
$731,098
$199,344
$930,442
31
$1,877,927
$875,244
$2,753,171
66
$9,072,755
$9,072,755
68
$23,642
$3,018,600
$3,042,242
81
$492,566
$3,927,670
$4,420,237
88
$6,606,733
$6,606,733
94
$1,690,004
$1,690,004
116
$319,847
$319,847
138
$4,370,068
$4,370,068
Total
$18,597,267
$20,850,396
$39,447,662
Average miles a ton of feedstock travelled
BEA
Surry
Greene
Total
ton-miles/ton
10
88
80
82
29
121
190
136
31
74
135
92
66
43
43
68
135
118
118
81
94
67
71
88
81
81
94
128
128
116
132
132
138
74
74
Total
64
92
78
Biorefinery Information
Biorefinery capacity is measured by feedstock input
In this analysis, biorefinery input was 725,000 dry tons per year
Assuming a Gasification Fischer Tropsch biorefinery with expected production in terms of
Sustainable Aviation Fuel – 40%
Diesel – 40%
Naphtha – 20%
1,450,000 wet tons dried 10% moisture content
Working 330 days/year and 10 hours/day, 21-22 trucks must be emptied every hour or 1 truck every 2.7 minutes if they are hauling 20 tons of chips. If they have a longer trailer and can haul 22.5 tons of chips, then they need to unload 19 to 20 trucks per hour.
The biorefineries
Each with a capacity of 725,000 dry short tons or 657,000 dry MT per year
Two biorefineries were located.
Surry, NC
Greene, TN
Each producing
SAF – 16.7 million gallons
Diesel – 14.3 million gallons
Naphtha – 8.3 million gallons
Gross Revenues
Fuel – $343 million
RINS — $141 million
Assumes RIN price of $1.22 and an EV factor of 1.7 for SAF and Diesel.
Breakeven Plant Gate Fuel Price when assuming RINs and a 12.2% on investment
SAF — $4.32/gallon
Diesel – $4.59/gallon
Naphtha – $3.88/gallon
Biorefinery Operations
Biorefinery Investment and Operating
SAF Prices
County
State
BEA
Investment (CAPEX)
Operating (OPEX)
No Incentives
With RIN Incentive
Million $
$ per gallon
Surry
NC
66
$703
$142
$6.04
$4.32
Greene
TN
81
$706
$153
$6.35
$4.63
Total/Average
$1,409
$296
$6.19
$4.48
RIN values based on D3 July-Dec 2020 RIN average value or $1.22 multiplied times the EV value of 1.7. Adapted from Brandt, K, Tanzil AH, Garcia-Perez M, Wolcott M, 2021, GFT_CAEP-v6.xlsm, Excel Notebook, January 1,2021 email.
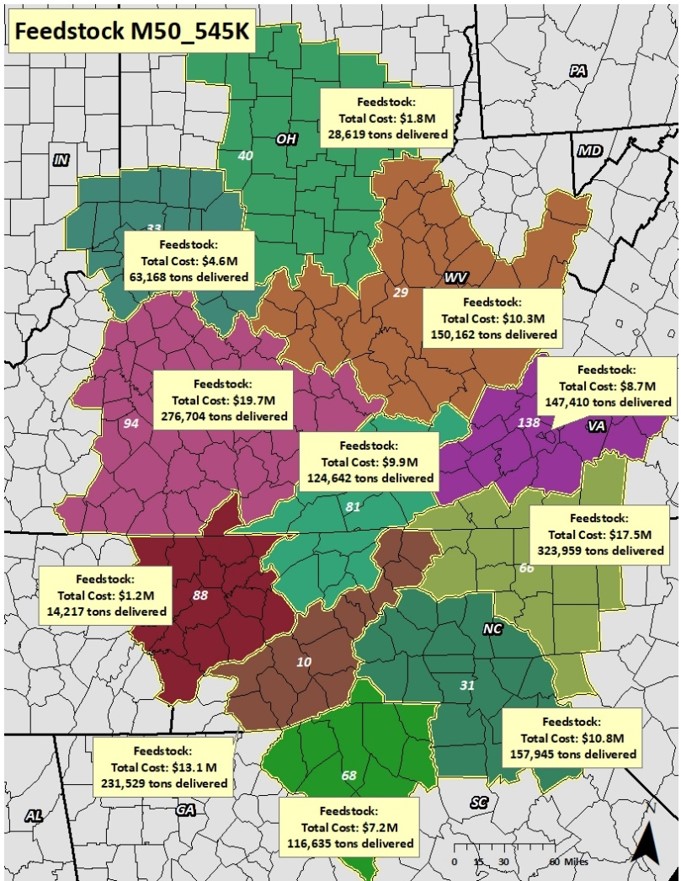
Operating Expenses
Fixed Operating Costs include: 1% of FCI for insurance, 1.5% of FCI for local taxes, and 6% of FCI for maintenance. In addition, Overhead is estimated at 60% of salaries.
FCI=Fixed Capital Investment
Economic Impact of Investment to the Central Appalachian Region if the five Biorefineries Are Established
With an investment of $1.4 billion, more than $1.0 billion is spent in the region
This results $1.78 billion in total TIO resulting in a multiplier of 1.68. For every million dollars spent, an additional $0.68 million is generated in the regional economy.
This results in an increase in Gross Regional Product of $850 million.
Employment increases also.
Over 12,200 jobs are created during the construction period of these biorefineries.
Resulting in $660 million in labor income when incorporating the multiplier effect.
Total industry output is defined as the annual dollar value of goods and services that an industry produces. Employment represents total wage and salary employees, as well as self-employed jobs in a region, for the both full- and part-time workers. Labor income consist of employee compensation and proprietor income. Total value added is defined as all income to workers paid by employers (employee compensation); self-employed income (proprietor income); interests, rents, royalties, dividends, and profit payments; and excise and sales taxes paid by individuals to businesses.
Final Comments
Using the ASCENT GFT to SAF TEA and BioFLAME to simulate the location and transportation of feedstock, it is determined in this static modelling approach that the biorefinery could sell their SAF at $6.04 per gallon with a rate of return of 12.2% on their investment. If the wood qualified for RINs, the price would be reduced to $4.48 per gallon assuming D3 RIN price of $1.22 per gallon and an EV factor of 1.7.
The economic analysis demonstrates, using GFT, to be feasible, the airlines will need to purchase the fuel at a price higher than current levels of aviation fuel or additional subsidies will be required in order to reduce the manufacturing cost.
Regional impacts do occur. It is estimated that the increase in supply chain expenditures would lead to an increase of $549 million through direct expenditures and 959 million after the multiplier affect is measured annually.
In addition, the investment in two biorefineries of $1.05 billion leads to a regional impact of $1.78 billion.
The analysis assumes that no additional investment will be required in the logging industry or the transportation industry.