BEAG utilizes a diverse set of peer-reviewed and documented model platforms, including:
- BeSTA — A biorefinery siting programming model that provides information on minimum cost feedstock as well as greenhouse gas emissions in the feedstock supply chain;
- BioFLAME — A facility siting spatial model;
- DayCENT — A daily time series biogeochemical model that simulates fluxes of carbon and nitrogen between the atmosphere, vegetation, and soil for alternative land uses developed by Colorado State University
- EPIC — An Environmental Policy Integrated Climate model developed to estimate soil productivity as affected by erosion;
- FLARE — A farm level programming model that incorporates risk and uncertainty into the analysis of biofuel systems;
- ForSEAM — A national forest optimization model;
- GREET — A full life-cycle model sponsored by the Argonne National Laboratory;
- IMPLAN — A regional input-output model;
- MOSS — A micro-oriented sediment simulator;
- POLYSYS — A national, inter-regional, agricultural model; and
- SPARROW — A modeling tool that provides changes in water quality indicators related to land use changes.
Collectively, these models are used to quantify supply and demand for biomass; the cost of biomass production; conversion costs; economic feasibility of bio-based energy; regional and national economic and environmental impacts; and market opportunities for biomass, biofuels, and co-products.
The core of BEAG’s modeling efforts combine input-output analyses with partial equilibrium models of the agriculture and forestry sectors. To support these models, BEAG members have extensive experience collecting primary survey information through a variety of channels, including the internet, postal mail, and in-person interviews.
BeSTA
The Bio-energy Site and Technology Assessment (BeSTA) model is a spatially-oriented, mixed-integer mathematical programming model that simulates lignocellulosic biomass (LCB) feedstock supply chain activities at the biorefinery level. Remote-sensing data, including the yields of both traditional and energy crops and soil types at the sub-county level, and road networks are acquired from a geographical information system resource model, BioFLAME. The integration of the mathematical programming and GIS data sources is designed to identify the potentially LCB feedstock supply area and optimal location of the biorefinery and satellite preprocessing facilities by minimizing LCB feedstock’s total plant-gate cost, subject to the size of biorefinery, throughput of the preprocessing facilities, the existing road networks, and the availability of biomass feedstock. In addition to facilities location and feedstock supply area, the monthly harvest, delivery and storage volume of feedstock can be also determined in the model.
BioFLAME
The University of Tennessee’s Biofuels Facility Location Analysis Modeling Endeavor (BioFLAME) is a large-scale, multi-regional optimization model that determines the least-cost locations of biofuel facilities supplying aviation fuel to airports, and the attendant changes in land use, given the location of pine. BioFLAME is currently calibrated for the southeastern US but is capable of being calibrated for other regions. The GIS layers will be expanded to accommodate the distribution of demand centers for aviation fuels. BioFLAME operates on GIS architecture consisting of three components—site suitability, feedstock availability, and land conversion. Road networks, transmission lines, and other geo-spatial layers are used to identify candidate refinery locations. BioFLAME estimates:
- the cost minimizing locations where feedstock would be sourced to supply a biorefinery,
- the annual cost of procuring and transporting feedstock,
- the number of facilities a region can support.
BioFLAME provides information on site location, delivered feedstock costs, transportation emissions, direct land use change, potential supply, delivery of suite of products produced by the biorefinery, and transportation costs. In addition, the model can be run for a single site. It can provide information given product demand requirements, current cost of production and transportation, and information on a few environmental-related data, e.g., carbon, water use, soil quality.
BioFLAME Supply Regions
The United States is divided into 5 sq. mile hexagons. In the Southeast there are 1.3 million supply units.
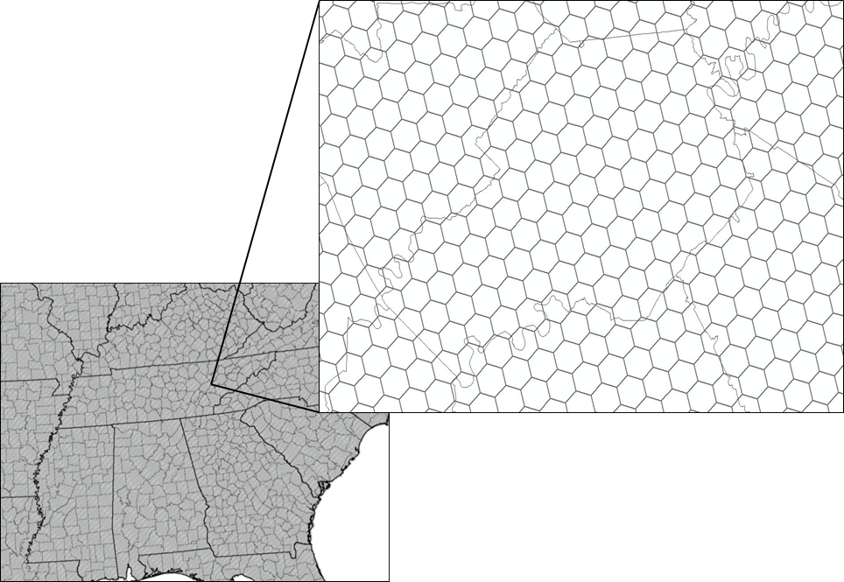
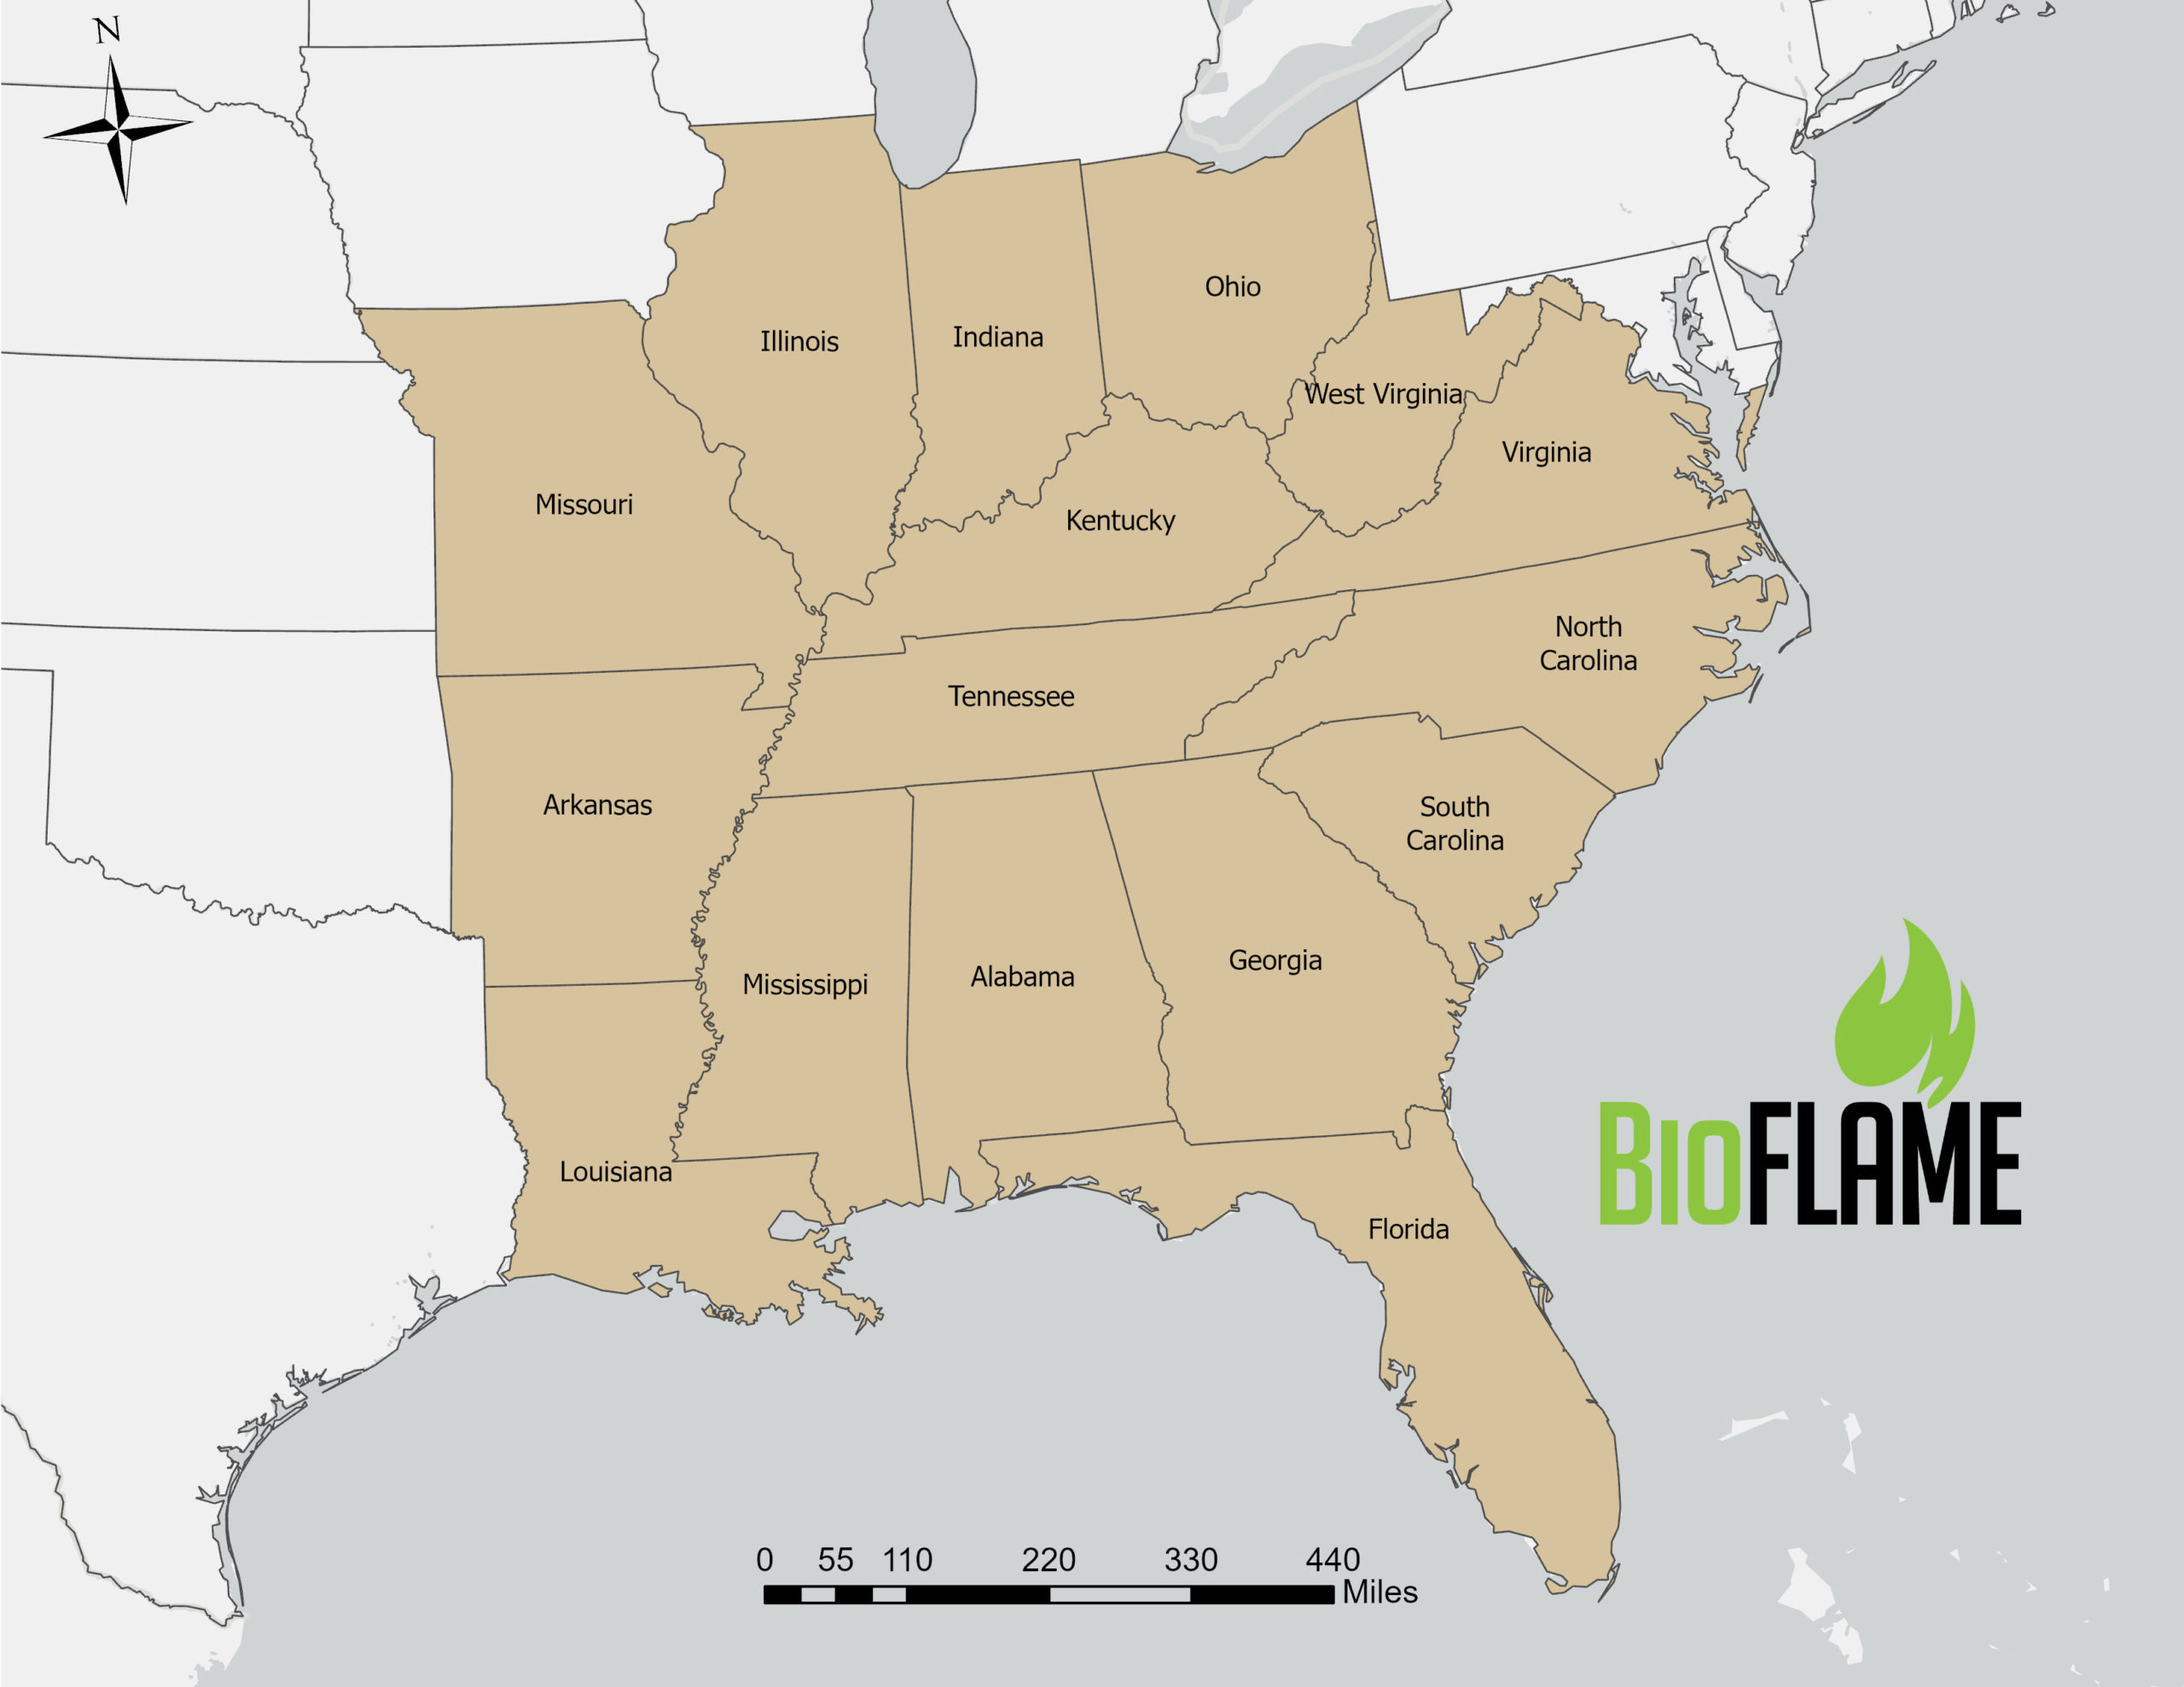
The states included in the LEAF Project Southeast Analysis are Tennessee, Kentucky, Virginia, north Carolina, South Carolina, Georgia, Florida, Alabama, and Mississippi along with a 50 mile extension into neighboring states.
DayCENT
A daily time series biogeochemical model that simulates fluxes of carbon and nitrogen between atmosphere, vegetation, and soil for alternative land uses developed by Colorado State University. Learn more about the DayCENT model.
EPIC
Environmental Policy Integrated Climate (EPIC) model is a cropping systems model initially developed to estimate soil productivity as affected by erosion as part of the Soil and Water Resources Conservation Act analysis for 1985. Currently, EPIC simulates approximately eighty crops with one crop growth model using unique parameter values for each crop. It predicts effects of management decisions on soil, water, nutrient and pesticide movements, and their combined impact on soil loss, water quality, and crop yields. Using regional soils data and weather data, yields and yield variability can be estimated for the United States. Currently, the model is linked to PRISM weather data and a soil file based on the 1997 NRI database along with EPIC internal soils datafile. The soil file has soils identified as major soils by state portion of MLRAs for cropland, pasture, and CRP. Learn more about EPIC model.
FLARE
The Firm Level Agricultural Risk and Environmental Modeling Framework (FLARE) consists of risk mathematical programming firm level economic models. The modeling includes representative farm models and biorefinery conversion models, incorporates switchgrass feedstock harvest, storage and delivery models, and simulates output and net revenues for traditional beef cattle and crop enterprise choices considering typical resource constraints such as soil type, labor availability, field day availability, and crop rotation requirements, etc. The biorefinery feedstock model simulates switchgrass yields and the costs of production including opportunity costs on land by soil type for a designated feedstock draw area. The mixed integer programming model optimizes the production and delivery of switchgrass feedstock to the biorefinery considering costs of production, harvest and preprocessing method, storage method, and dry matter losses during handling and storage.
ForSEAM
The Forest Sustainable and Economic Analysis (ForSEAM) model was constructed to estimate forest land production over time and its ability to produce not only traditional forest products, but also products to meet biomass feedstock demands through a cost-minimization algorithm. This model was used recently to identify the amount of logging residuals that might be available from logging and thinning activities on private and public lands in the US. Researchers in the Departments of Energy and Agriculture in the Billion Ton 2016 publication used these estimates.
It provides the softwood or hardwood feedstock supply layer once downscaled to the 5 square mile hexagons using the cropland data layer published by NASS.
Hardwood Supply
Hardwood Supply is based on the 2016 Billion Ton study.
The data was developed for 305 regions in the United States and downscaled to BioFLAME supply regions
Hardwood Supply
Softwood Supply is based on the 2016 Billion Ton study.
The data was developed for 305 regions in the United States and downscaled to BioFLAME supply regions
GREET
A full life-cycle model sponsored by the Argonne National Laboratory. Learn more about GREET.
IMPLAN
IMPLAN will project the economic impacts of renewable energy growth. The model will be modified to incorporate the systems developed by the project and evaluate addition of renewable energy facilities into a study region, which may be national, regional, state, or a group of counties. Output will consists of projections of the impacts as a result of adding the industry and its interactions with other industries in the economy for total industrial output, employment, gross domestic product, and taxes.
MOSS
The Micro-Oriented Sediment Simulator (MOSS) is intended as an aid to soil erosion researchers and policymakers in assessing the offsite cost impacts of various erosion scenarios. Required information includes land use in broad terms of cropland, range, and forest and total erosion from each of these broad land use categories. These data are entered in at a 4 digit HUA level (99 Aggregated Subareas developed by the Water Resources Board). These data, when merged with sediment delivery ratios developed by the Natural Resources Conservation Service and offsite erosion costs initially developed by Clark, Haverkamp, and Chapman, provide estimates on total sediment produced, a range of total offsite costs of sediment, a range of offsite costs per acre, and sediment per acre. These estimates are aggregated and reported at the ten USDA production region level.
POLYSYS
The Policy Analysis System (POLYSYS) is a dynamic stochastic (in yields) model of the US agricultural sector, capable of estimating the competitive allocation of agricultural land and crop prices associated with changes in yield and management practices. Input requirements include a baseline solution typically from USDA, and policy or resource changes desired for a particular scenario. Output includes economic variables such as County‐level crop supply, national crop demands and prices, National livestock supply and demand, farm income, and land use including forest harvest, afforestation, and pasture conversion. In addition, through the environmental module, estimates of changes in carbon emission and sequestration, soil erosion and sediment, fertilizer use, and chemical use are provided.
SPARROW
The US Geological Survey’s (USGS) SPAtially Referenced Regressions On Watershed (SPARROW) water quality model is a statistical mass balance hydrologic model that estimates the major sources and environmental factors determining the long-term supply, transport, and fate of surface water systems (Smith et al., 1997). Using separate land and hydrology components, the model relates in-stream water-quality measurements to spatially referenced characteristics of watersheds, including contaminant sources and factors influencing terrestrial and aquatic transport. It provides estimates resulting from land use change by linking watersheds where land use change occurs to larger water bodies with information on changes in watershed characteristics and contaminant sources. The SPARROW model generates ex-ante forecasts of the impacts land use changes have on water quality through changes in point and non-point source nutrient runoff variables using nonlinear least squares regression relationships. There are over 50 Journal articles that have been published that use this modeling tool.
Smith, R.A., Schwarz, G.E., Alexander, R.B., 1997. Regional interpretation of water-quality monitoring data. Water Resource Research 33 (12), 2781–2798.