AIM-AG was established in 1998 as part of the Department of Agricultural and Resource Economics, Agricultural Experiment Station (now AgResearch). The mission of AIM-AG is to assess and project the impacts of agri-industry development on the Tennessee economy and to analyze market opportunities for economically efficient agri-industry development within the state.
AIM-AG
- Evaluates the impacts the agricultural and forest products industry has on the state’s economy and the economics of regions within the state using TN-AIM (Tennessee Agri-Industry Model), an economic modeling system;
- Conducts “what-if” scenarios designed to evaluate the impacts that occur from development of selected value-added industries in the state and regions within the state;
- Conducts research studies on market growth opportunities for value-added or high-value agri-industry products;
- Analyzes market potential and feasibility for value-added or high-value products produced or processed within the state and;
- Provides market information and prospectus studies to aid industrial recruitment and development.
Our clientele
- Agribusiness decision-makers
- Producer and processor organizations
- Economic and community development leaders
- Policy makers
- Local, county, and state governments
Our Research Activities
Evaluate economic impacts of agri-industry development
- Impact analysis of changes in agricultural production and technologies
- Impact of value-added industries development
- Natural resource limitations on development
- Implications of development on the environment
Assess market opportunities for agri-industry development through:
- Expansion of markets for the existing agribusiness segments, both domestic and international
- Increased marketing efficiency
- Expansion into new agribusiness segments
Methods of Analysis:
- Market potential studies
- Market feasibility studies for new agribusiness ventures
- Demand analysis
- Buyer and consumer preferences studies
- Market segmentation analysis and buyer profiling
- New product acceptance and potential
- Analysis of marketing alternatives
- Valuation of product attributes
Tennessee agriculture includes farming and related industries, as well as value-added food and fiber production, processing and manufacturing. Agriculture accounts for 7.6 percent of the state’s economy and generates $74.8 billion in output. Agriculture supported 299,180 Tennesseans, with 92,540 (both full- and part-time) in agriculture production. In 2023, Tennessee had approximately 63,100 farms covering 10.7 million acres. Approximately 61.3 percent of the farms had sales in the $1,000 to $9,999 sales category, 31.5 percent of the farms had sales in the $10,000 to $99,999 sales category, and 7.1 percent of the farms had sales of $100,000 and over. In 2023, Tennessee’s average farm size was 170 acres compared to 464 acres for the United States. Other southeastern states with similar average farm sizes as Tennessee include Kentucky at 179 acres, followed by Virginia at 187 acres and North Carolina at 191. Arkansas, Mississippi, and Louisiana have average farm sizes of 366, 331, and 323 acres, respectively. Listed below is an overview of Tennessee’s top agricultural commodities. Most values are for 2023.

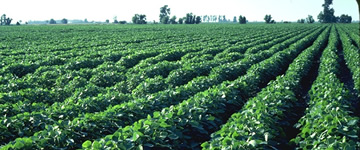
Soybeans = $991.3 million
- In 2023, approximately 80.1 million bushels of soybean were produced
- Harvested soybean acreages totaled 1.6 million acres
- Soybean yields averaged 51.0 bushels per acre
- Based on harvested acreage, Tennessee’s soybean industry was ranked 17th in the United States

Cattle & Calves – $876.7 million
- In 2023, Tennessee had roughly 1.68 million head of cattle and calves
- Number of beef cattle totaled 854,000
- Total cattle and calves production was 587.2 million pounds
- Based on inventory (all cattle), Tennessee’s cattle industry was ranked 12th in the United States
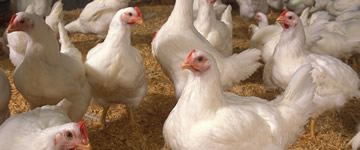
Broilers = $794.4 million
- In 2023, Tennessee produced 239.4 million broilers
- Broilers production totaled 1,436.4 million pounds
- Based on inventory, Tennessee’s broiler industry was ranked 13th in the United States
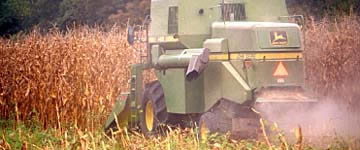
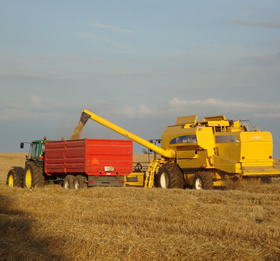
Corn – $652.3 million
- In 2023, Tennessee’s harvested corn acres totaled 890,000 acres
- Approximately 154.0 million bushels of corn were produced
- Yields averaged 173 bushels per acre Based on harvested acreage, Tennessee’s corn industry was ranked 17th in the United States
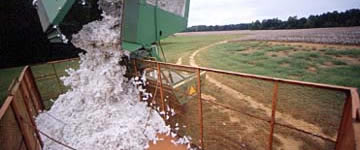
Cotton lint – $299.5 million
- In 2023, 677,000 bales of cotton were produced
- Acres harvested totaled 260,000
- Yields averaged 1,250 pounds per acre
- Cottonseed production totaled 207,000 tons
- Based on harvested acreage, Tennessee’s cotton industry was ranked 8th in the United States
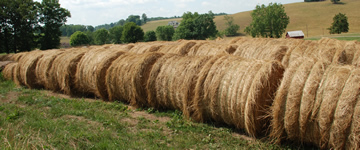
Hay – $236.9 million
- In 2023, close to 3.8 million tons of hay were produced on over 1.7 million acres
- The average yield was 2.21 tons per acre
- Alfalfa production totaled 50,000 tons on over 16,000 acres
- Alfalfa yields averaged 3.1 tons per acre
- Based on harvested acreage, Tennessee’s hay industry (not including alfalfa) was ranked 10th in the United States; alfalfa was ranked 31st
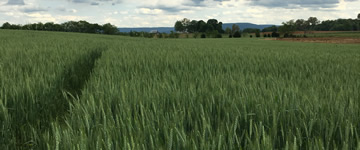
Wheat – $192.9 million
- In 2023, approximately 31.2 million bushels of wheat were produced
- Harvest acres totaled 390,000
- Yields averaged 80.0 bushels per acre
- Based on harvested acreage, Tennessee’s wheat industry was ranked 17th in the United States
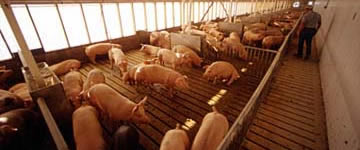
Hogs – $137.8 million
- In 2023, the number of hogs totaled 320,000
- Total hog and pig production was 229.0 million pounds
- Based on inventory, Tennessee’s hog industry was ranked 18th in the United States

Dairy – $100.5 million
- In 2023, 467.00 million pounds of milk were produced
- The number of milk cows totaled 25,000
- Based on inventory, Tennessee’s dairy industry was ranked 32nd in the United States

Eggs – $90.8 million
- In 2023, approximately 381.8 million eggs were produced
- Based on egg production, Tennessee’s egg industry was ranked 30th in the United States
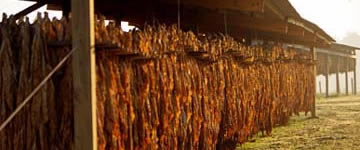
Tobacco – $75.5 million
- In 2023, approximately 8,950 acres were harvested
- Production totaled 22.3 million pounds
- Yields averaged 2,493 pounds per acre
- Varieties grown include burley and dark tobacco varieties
- Based on harvested acreage, Tennessee’s tobacco industry was ranked 3rd in the United States (all tobacco)
Sources:
U.S. Department of Agriculture, National Agricultural Statistical Service (NASS). 2024c. Farms and Land in Farms. 2023 Summary.
U.S. Department of Agriculture, Economic Research Service (ERS). 2025. Data Files: U.S. and State-Level Farm Income and Wealth Statistics. “Annual Cash Receipts by Commodity, US and States, 2008-2025F.”
U.S. Department of Agriculture, National Agricultural Statistical Service (NASS). 2025. “Cattle”
U.S. Department of Agriculture, National Agricultural Statistical Service (NASS). 2025. “Chicken and Eggs 2024 Summary.”
U.S. Department of Agriculture, National Agricultural Statistical Service (NASS). 2025. “Crop Production 2024 Summary.”
U.S. Department of Agriculture, National Agricultural Statistical Service (NASS). 2025. “Meat Animals Production, Disposition, and Income 2024 Summary.”
U.S. Department of Agriculture, National Agricultural Statistical Service (NASS). 2025. “Milk Production, Disposition, and Income 2024 Summary.”
U.S. Department of Agriculture, National Agricultural Statistical Service (NASS). 2025. “Poultry – Production and Value 2024 Summary.”
U.S. Department of Agriculture, National Agricultural Statistical Service (NASS). 2025. “Quarterly Hogs and Pigs.”
U.S. Department of Agriculture, National Agricultural Statistical Service (NASS). 2025. Quick Stats and Quick Stats Lite.
AIMAG research publications include economic impacts, market feasibility, cooperative studies, and/or survey related studies on agriculture/forestry industries, agriculture programs, bioenergy, livestock/crop sectors, food and beverage industries, livestock diseases, recreational activities, experiment stations, veterinary services, and bioenergy feedstock transportation.
Below is a listing of all areas for which we currently have publications.
- Economic Contribution/Impact Studies
- Agriculture and Forestry
- Agricultural Programs
- Livestock
- Crops
- Recreation
- TN AgResearch Centers
- Bioenergy
- Market/Feasibility Studies
- Ag/Forestry Inputs
- Primary Ag/Forestry
- Secondary Ag/Forestry
- Agritourism
- Other
- Studies on Cooperatives
- Study of Veterinary Services and Tennessee Animal Enterprises
- Water Analysis
- Agriculture and Forestry: Tennessee and Our Neighbors
Learn more by visiting our Publications page.
Decision-Aid Tool
The Wood Resource Transportation Analysis System (WTRANS) is a spreadsheet based program which allows wood residue users to examine:
- Where hardwood and softwood green mill residues may be located on a county-by-county basis in Tennessee,
- Estimates of transportation and delivered product costs on a county-to-county basis in Tennessee,
- Estimates of transportation and delivered product costs to your county from each county in Tennessee,
- Potential residue needs for energy use, and
- Estimated fuel cost comparisons using residues for greenhouse heating
Learn more by visiting our Decision-Aid Tools page.
AIMAG Personnel include: