by Aaron Smith, Crops Marketing Specialist
July 3, 2025
Overview
Cotton was down; corn, soybeans, and wheat were up for the week.
Grain and oilseed prices increased entering the July 4th weekend. Prices will continue to be sensitive to weather forecasts and the potential for positive trade deals. The 90-day tariff pause implemented by the Trump administration is scheduled to expire next week. The outcome remains unknown, but it seems likely some deals will be made with several countries while other countries may receive extensions. Increased market access or purchases of agricultural commodities could help push grain, oilseed, and fiber prices higher.
Purchasing call options are a strategy for producers to consider if they think the futures market price will increase. For example, as of July 3, a December 70 cent cotton call option could be purchased for 2.24. If cotton prices decline or remain below 70 cents, then the call purchaser is out the premium (maximum loss). If the December cotton futures price is between 70 and 72.24 cents the purchaser will recoup part of the premium – equal to 72.24 less the December cotton future price (not accounting for transaction costs). Purchasing a call option will pay a positive return if the December futures contract, between now and expiration, is above 72.24 cents. The profit would be the December futures contract less 72.24 and any transaction costs.
If a producer thinks that the December future contract will increase to the mid or upper 70 cent range before contract expiration, this may be a worthwhile strategy to consider. A benefit of purchasing options (unlike futures) is that the maximum loss is defined (the premium paid). Before entering any futures or options position be sure to determine all possible outcomes. For those new to futures and options trading working with a qualified professional is strongly advised.
| Indicator | Previous | Current | Change |
|---|---|---|---|
| USD Index | 97.05 | 96.82 | -0.23 |
| Crude Oil | 65.35 | 67.18 | 1.83 |
| DJIA | 43,598 | 44,829 | 1,230 |
Corn
Across Tennessee, average corn basis (cash price-nearby futures price) strengthened or remained unchanged at West, Northwest, North-Central, West-Central, and Mississippi River elevators and barge points. Overall, basis for the week ranged from 5 under to 40 over, with an average of 18 over the September futures at elevators and barge points. Ethanol production for the week ending June 27 was 1.076 million barrels per day, down 5,000 compared to the previous week. Ethanol stocks were 24.117 million barrels, down 0.287 million barrels compared to last week. Corn net sales reported by exporters for June 20-26 were net sales of 21.0 million bushels for the 2024/25 marketing year and 37.0 million bushels for the 2025/26 marketing year. Exports for the same period were down less than 1% compared to last week at 57.7 million bushels. Corn export sales and commitments were 100% of the USDA estimated total annual exports for the 2024/25 marketing year (September 1 to August 31) compared to the previous 5-year average of 100%. Cash prices ranged from $4.01 to $4.58 at elevators and barge points. September 2025 corn futures closed at $4.20, up 9 cents since last Friday. For the week, September 2025 corn futures traded between $4.00 and $4.26. Sep/Dec and Sep/Mar future spreads were 17 and 32 cents.
| Corn | Sep 25 | Change | Dec 25 | Change |
|---|---|---|---|---|
| Price | $4.20 | $0.09 | $4.37 | $0.10 |
| Support | $4.12 | $0.11 | $4.27 | $0.12 |
| Resistance | $4.30 | $0.10 | $4.46 | $0.13 |
| 20 Day MA | $4.19 | -$0.02 | $4.35 | -$0.02 |
| 50 Day MA | $4.27 | -$0.04 | $4.41 | -$0.02 |
| 100 Day MA | $4.40 | -$0.02 | $4.49 | -$0.01 |
| 4-Week High | $4.34 | -$0.03 | $4.50 | $0.00 |
| 4-Week Low | $4.00 | -$0.02 | $4.16 | -$0.03 |
| Technical Trend | Down | = | Down | = |
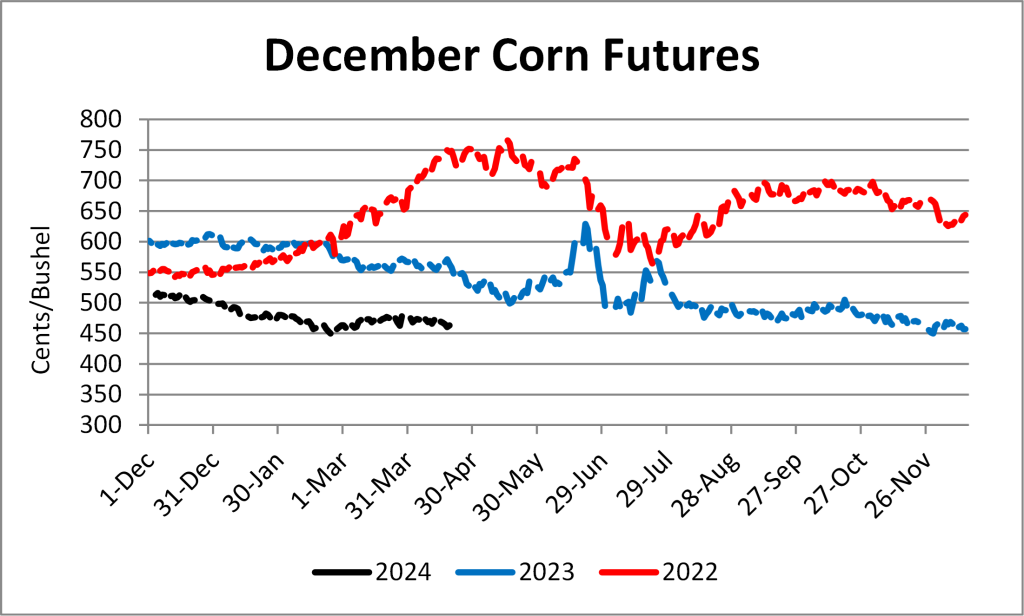
Nationally, the Crop Progress report estimated corn condition at 73% good-to-excellent and 5% poor-to-very poor; and corn silking at 8% compared to 4% last week, 10% last year, and a 5-year average of 6%. In Tennessee, corn condition was estimated at 64% good-to-excellent and 12% poor-to-very poor; and corn silking at 45% compared to 29% last week, 50% last year, and a 5-year average of 34%. This week, Oct/Nov cash contracts ranged from $3.92 to $4.19 at elevators and barge points. December 2025 corn futures closed at $4.37, up 10 cents since last Friday. Downside price protection could be obtained by purchasing a $4.40 December 2025 Put Option costing 24 cents establishing a $4.16 futures floor. March 2026 corn futures closed at $4.52, up 10 cents since last Friday.
Soybeans
Across Tennessee the average soybean basis weakened or remained unchanged at West, Northwest, North-Central, West-Central, and Mississippi River elevators and barge points. Average basis ranged from 45 under to even the August futures contract, with an average basis at the end of the week of 22 under. Soybean net weekly sales reported by exporters were net sales of 17.0 million bushels for the 2024/25 marketing year and 8.8 million bushels for the 2025/26 marketing year. Exports for the same period were down 5% compared to last week at 9.2 million bushels. Soybean export sales and commitments were 99% of the USDA estimated total annual exports for the 2024/25 marketing year (September 1 to August 31), compared to the previous 5-year average of 102%. Cash soybean prices at elevators and barge points ranged from $9.84 to $10.54. August 2025 soybean futures closed at $10.55, up 22 cents since last Friday. For the week, August 2025 soybean futures traded between $10.16 and $10.64. The September soybean-to-corn price ratio was 2.48 at the end of the week. September 2025 soybean futures closed at $10.41, up 24 cents since last Friday. Aug/Sep and Aug/Nov future spreads were -14 and -6 cents.
| Soybeans | Aug 25 | Change | Nov 25 | Change |
|---|---|---|---|---|
| Price | $10.55 | $0.22 | $10.49 | $0.25 |
| Support | $10.43 | $0.26 | $10.36 | $0.32 |
| Resistance | $10.70 | $0.22 | $10.64 | $0.22 |
| 20 Day MA | $10.50 | $0.01 | $10.39 | $0.03 |
| 50 Day MA | $10.49 | $0.00 | $10.36 | $0.00 |
| 100 Day MA | $10.42 | -$0.02 | $10.30 | -$0.02 |
| 4-Week High | $10.82 | $0.00 | $10.74 | $0.00 |
| 4-Week Low | $10.16 | -$0.06 | $10.13 | $0.00 |
| Technical Trend | Down | = | Down | = |
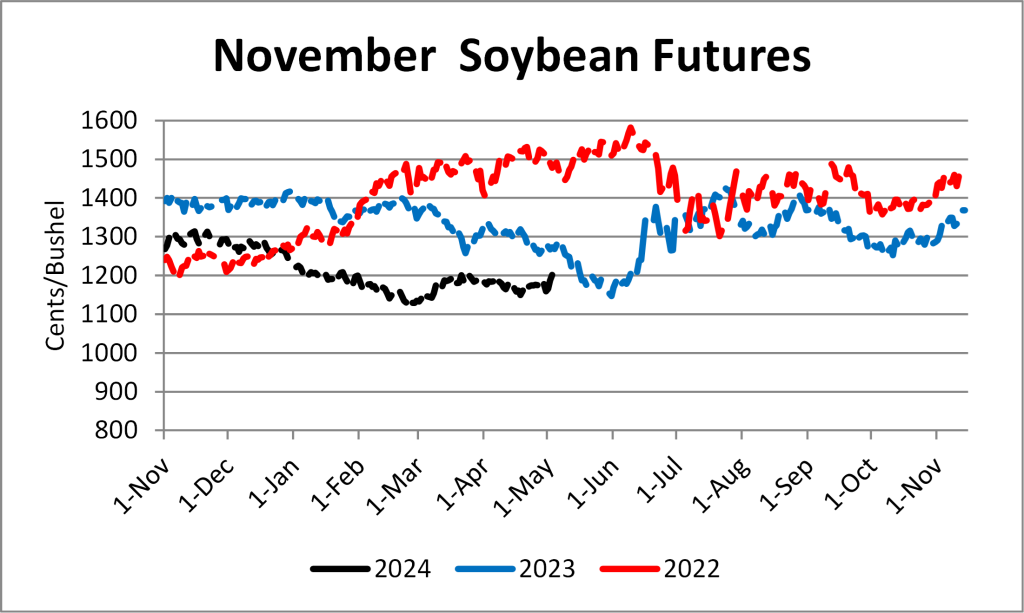
Nationally, the Crop Progress report estimated soybean condition at 66% good-to-excellent and 7% poor-to-very poor; soybeans emerged at 94% compared to 90% last week, 94% last year, and a 5-year average of 95%; soybeans blooming at 17% compared to 8% last week, 18% last year, and a 5-year average of 16%; and soybeans setting pods at 3% compared to 3% last year and a 5-year average of 2%. In Tennessee, soybean condition was estimated at 55% good-to-excellent compared to 15% poor-to-very poor, soybeans emerged at 79% compared to 74% last week, 86% last year, and a 5-year average of 86%; soybeans blooming at 24% compared to 16% last week, 39% last year, and a 5-year average of 22%; and soybeans setting pods at 3% compared to 4% last year and a 5-year average of 2%. Oct/Nov cash prices at elevators and barge points were $9.87 to $10.36 for the week. November 2025 soybean futures closed at $10.49, up 25 cents since last Friday. Downside price protection could be achieved by purchasing a $10.50 November 2025 Put Option which would cost 39 cents and set a $10.11 futures floor. Nov/Dec 2025 soybean-to-corn price ratio was 2.40 at the end of the week.
Cotton
North Delta upland cotton spot price quotes for July 2 were 66.92 cents/lb (41-4-34) and 68.92 cents/lb (31-3-35). Upland cotton adjusted world price (AWP) increased 1.16 cents to 55.34 cents. Cotton net weekly sales reported by exporters were net sales of 23,700 bales for the 2024/25 marketing year and 106,600 bales for the 2025/26 marketing year. Exports for the same period were up 39% compared to last week at 255,800 bales. Upland cotton export sales were 109% of the USDA estimated total annual exports for the 2024/25 marketing year (August 1 to July 31), compared to the previous 5-year average of 116%.
| Cotton | Dec 25 | Change | Mar 26 | Change |
|---|---|---|---|---|
| Price | 68.46 | -0.86 | 69.78 | -0.82 |
| Support | 67.79 | 0.48 | 69.21 | 0.48 |
| Resistance | 69.31 | -0.54 | 70.47 | -0.56 |
| 20 Day MA | 67.95 | 0.02 | 69.25 | 0.00 |
| 50 Day MA | 68.38 | 0.00 | 69.68 | 0.02 |
| 100 Day MA | 68.61 | -0.02 | 69.80 | -0.01 |
| 4-Week High | 69.52 | 0.00 | 70.79 | 0.00 |
| 4-Week Low | 66.27 | 0.00 | 67.51 | 0.00 |
| Technical Trend | Up | = | Up | = |
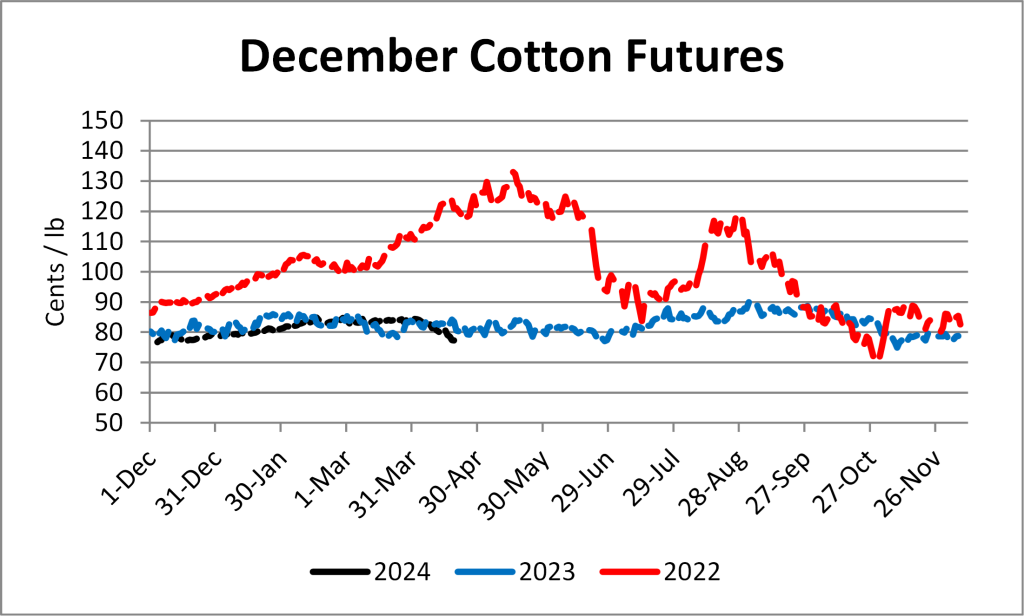
Nationally, the Crop Progress report estimated cotton condition at 51% good-to-excellent and 17% poor-to-very poor; cotton planted at 95% compared to 92% last week, 97% last year, and a 5-year average of 98%; cotton squaring at 40% compared to 26% last week, 41% last year, and a 5-year average of 37%; and cotton setting bolls at 9% compared to 5% last week, 11% last year, and a 5-year average of 9%. In Tennessee, cotton condition was estimated at 44% good-to-excellent and 16% poor-to-very poor; cotton planted at 92% compared to 91% last week, 100% last year, and a 5-year average of 100%; cotton squaring at 37% compared to 19% last week, 53% last year, and a 5-year average of 41%; and cotton setting bolls at 1% compared to 1% last week, 8% last year, and a 5-year average of 6%. December 2025 cotton futures closed at 68.46 cents, down 0.86 cents since last Friday. For the week, December 2025 cotton futures traded between 67.76 and 69.48 cents. Dec/Mar and Dec/May cotton futures spreads were 1.32 cents and 2.36 cents. Downside price protection could be obtained by purchasing a 69 cent December 2025 Put Option costing 3.11 cents establishing a 65.89 cent futures floor. March 2026 cotton futures closed at 69.78 cents, down 0.82 cents since last Friday. May 2026 cotton futures closed at 70.82 cents, down 0.68 cents since last Friday.
Wheat
Wheat net weekly sales reported by exporters were net sales of 21.5 million bushels for the 2025/26 marketing year. Exports for the same period were up 116% compared to last week at 21.3 million bushels. Wheat export sales were 32% of the USDA estimated total annual exports for the 2025/26 marketing year (June 1 to May 31), compared to the previous 5-year average of 31%. Nationally, the Crop Progress report estimated winter wheat condition at 48% good-to-excellent and 20% poor-to-very poor; winter wheat harvested at 37% compared to 19% last week, 52% last year, and a 5-year average of 42%; spring wheat condition at 53% good-to-excellent and 14% poor-to-very poor; spring wheat emerged at 96% compared to 93% last week, 100% last year, and a 5-year average of 100%; and spring wheat headed at 38% compared to 17% last week, 35% last year, and a 5-year average of 37%. Wheat cash prices at elevators and barge points ranged from $4.78 to $5.31.
| Wheat | Sep 25 | Change | Jul 26 | Change |
|---|---|---|---|---|
| Price | $5.56 | $0.16 | $6.16 | $0.18 |
| Support | $5.48 | $0.16 | $6.10 | $0.18 |
| Resistance | $5.73 | $0.24 | $6.26 | $0.19 |
| 20 Day MA | $5.56 | $0.00 | $6.14 | -$0.01 |
| 50 Day MA | $5.51 | -$0.02 | $6.10 | -$0.02 |
| 100 Day MA | $5.70 | -$0.02 | $6.22 | -$0.02 |
| 4-Week High | $5.94 | $0.00 | $6.50 | $0.00 |
| 4-Week Low | $5.34 | -$0.02 | $5.93 | -$0.03 |
| Technical Trend | Down | = | Down | = |
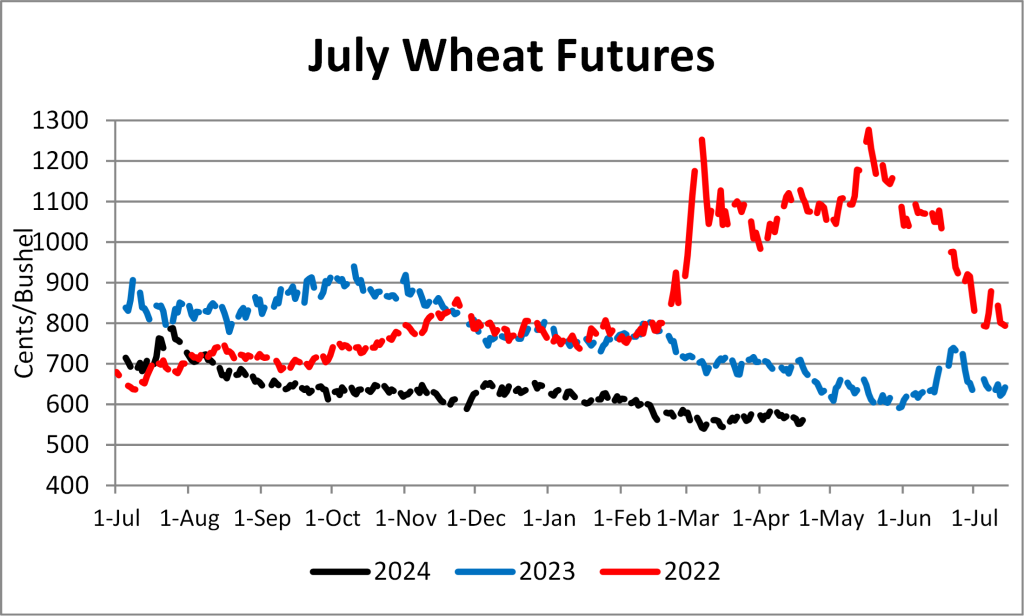
September 2025 wheat futures closed at $5.56, up 16 cents since last Friday. September 2025 wheat futures traded between $5.34 and $5.68 this week Sep/Dec and Sep/Jul future spreads were 22 and 60 cents. The September wheat-to-corn price ratio was 1.32. December 2025 wheat futures closed at $5.78, up 15 cents since last Friday. July 2026 wheat futures closed at $6.16, up 18 cents since last Friday. Downside price protection could be obtained by purchasing a $6.20 July 2026 Put Option costing 56 cents establishing a $5.64 futures floor.
Additional Information
Links for data presented:
U.S. Export Sales – https://apps.fas.usda.gov/export-sales/esrd1.html
USDA FAS: Weekly Export Performance Indicator – https://apps.fas.usda.gov/esrquery/esrpi.aspx
EIA: Weekly ethanol Plant Production – https://www.eia.gov/dnav/pet/pet_pnp_wprode_s1_w.htm
EIA: Weekly Supply Estimates – https://www.eia.gov/dnav/pet/pet_sum_sndw_a_EPOOXE_sae_mbbl_w.htm
Upland Cotton Reports – https://www.fsa.usda.gov/FSA/epasReports?area=home&subject=ecpa&topic=fta-uc
Tennessee Crop Progress – https://www.nass.usda.gov/Statistics_by_State/Tennessee/Publications/Crop_Progress_&_Condition/
U.S. Crop Progress – http://usda.mannlib.cornell.edu/MannUsda/viewDocumentInfo.do?documentID=1048
USDA AMS: Market News – https://www.ams.usda.gov/market-news/search-market-news
If you would like further information or clarification on topics discussed in the crop comments section or would like to be added to our free email list please contact me at aaron.smith@utk.edu.