by Andrew Griffith, Livestock Marketing Specialist
July 24, 2026
Overview
Corn, Soybeans, Cotton, and Wheat up for the week
Fuel
This week, Tennessee fuel have remained relatively stable over the past month but have increased in recent days and are substantially higher than a year ago. Current average prices stand at $3.72 per gallon for regular gasoline, $4.18 for mid-grade, $4.59 for premium, and $4.93 for diesel. Compared with one week ago, prices have risen $0.09 to $0.11 per gallon for gasoline products and $0.16 per gallon for diesel, while current prices are $0.24 per gallon higher than one month ago. The most significant changes are evident in the year-over-year comparison, with regular gasoline increasing from $2.81 to $3.72 per gallon, premium gasoline rising from $3.68 to $4.59, and diesel climbing from $3.47 to $4.93 per gallon.
| Fuel | Regular | Mid-Grade | Premium | Diesel |
|---|---|---|---|---|
| Current Avg. | $3.72 | $4.18 | $4.59 | $4.93 |
| Yesterday Avg. | $3.71 | $4.18 | $4.59 | $4.90 |
| Week Ago Avg. | $3.61 | $4.09 | $4.50 | $4.77 |
| Month Ago Avg. | $3.47 | $3.94 | $4.35 | $4.63 |
| Year Ago Avg. | $2.81 | $3.28 | $3.68 | $3.47 |
| Previous | Current | Change | |
|---|---|---|---|
| USD Index | 100.77 | 101.47 | 0.7 |
| Crude Oil | 82.15 | 90.47 | 8.32 |
| DJIA | 52,242.00 | 51,947.25 | -294.75 |
Corn
Across Tennessee, average corn basis (cash price-nearby futures price) remained unchanged from last week at West, Northwest, West-Central, North-Central, and Mississippi River elevators and barge points. Overall, basis for the week ranged from 2 cents under to 16 cents over, with an average of 7 cents over the September futures at elevators and barge points. Ethanol production for the week ending July 17th was 1.094 million barrels, up 54,000 barrels compared to the previous week. Ethanol stocks were 24.481 million barrels, up 90,000 barrels compared to the previous week. Cash prices ranged from $4.42 to $5.07 at elevators and barge points. On Friday, September 2026 corn futures closed at $4.64, which is up 19 cents compared to last week. For the week, September 2026 corn futures traded between $4.45 and $4.68.
| Corn | Sept 26 | Change | Dec 26 | Change |
|---|---|---|---|---|
| Price | $4.64 | $0.19 | $4.88 | $0.21 |
| Support | $4.57 | $0.18 | $4.80 | $0.19 |
| Resistance | $4.71 | $0.23 | $4.95 | $0.25 |
| 20 Day MA | $4.39 | $0.09 | $4.61 | $0.11 |
| 50 Day MA | $4.43 | -$0.02 | $4.62 | -$0.01 |
| 100 Day MA | $4.58 | $0.01 | $4.74 | $0.01 |
| 4-week High | $4.68 | $0.16 | $4.92 | $0.18 |
| 4-Week Low | $1.06 | $0.00 | $4.26 | $0.00 |
| Technical Trend | UP | = | UP | = |
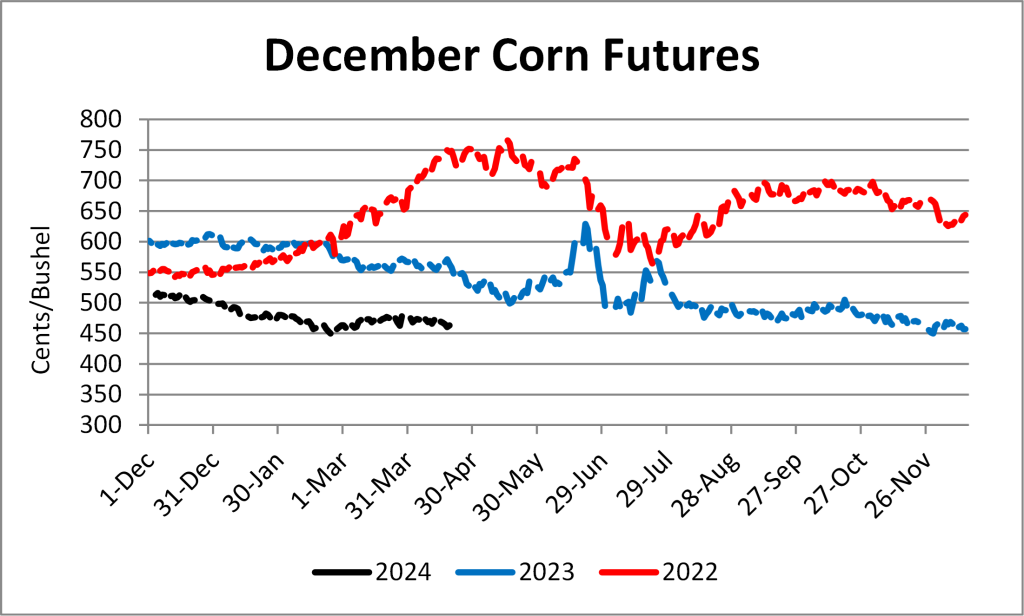
Nationally, the Crop Progress report estimated corn condition at 67% good-to-excellent (down 1% from last week) and 9% poor-to-very poor (down 1% from last week); corn silking to be 59% compared to 34% last week, 53% last year, and a 5-year average of 54%. In Tennessee, corn condition was estimated at 80% good-to-excellent (up 3% from last week) and 4% poor-to-very poor (down 2% from last week). This week new crop cash contracts ranged from $4.41 to $4.88 at elevators and barge points.For the week of July 10-16, 2026, net sales of 332,700 MT for 2025/2026 (marketing-year low) were up 6% from the previous week and down 44% from the prior 4-week average. Net sales of 701,500 MT for 2026/2027 were primarily for unknown destinations (168,000 MT), Colombia (148,100 MT), Japan (127,000 MT), Mexico (95,800 MT), and Spain (80,000 MT). Exports of 1,786,400 MT were up 13 percent from the previous week and 6 percent from the prior 4-week average. December corn futures closed at $4.88, up 21 cents from last week.
Soybeans
Across Tennessee average soybean basis remained the same compared to last week at West, Northwest, North-Central, West-Central, and Mississippi River elevators and barge points. Average basis ranged from 40 under to 5 cents over the August futures contract, with an average basis of 21 under at the end of the week. Cash soybean prices at elevators and barge points ranged from $11.80 to $12.74. September 2026 soybean futures closed at $12.40, up 47 cents compared to last week. For the week, September 2026 soybean futures traded between $11.97 and $12.43.
| Soybeans | Sept 26 | Change | Nov 26 | Change |
|---|---|---|---|---|
| Price | $12.40 | $0.47 | $12.54 | $0.51 |
| Support | $12.28 | $0.46 | $12.42 | $0.50 |
| Resistance | $12.52 | $0.53 | $12.66 | $0.57 |
| 20 Day MA | $11.82 | $0.25 | $11.93 | $0.23 |
| 50 Day MA | $11.64 | $0.04 | $11.76 | $0.06 |
| 100 Day MA | $11.61 | $0.05 | $11.67 | $0.06 |
| 4-week High | $12.43 | $0.49 | $12.57 | $0.50 |
| 4-Week Low | $11.11 | $0.00 | $11.25 | $0.00 |
| Technical Trend | UP | = | UP | = |
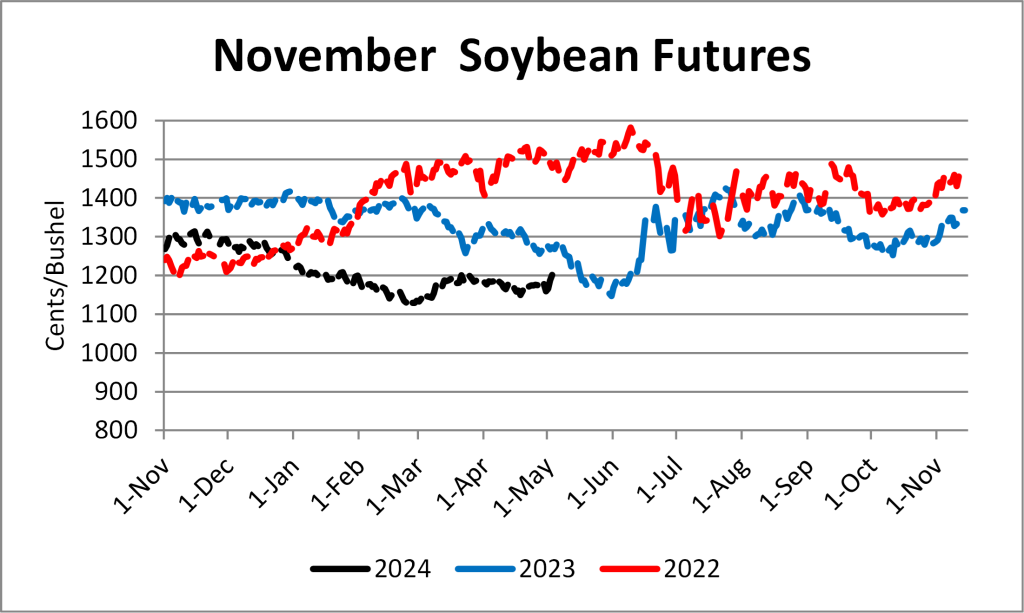
Nationally, the Crop Progress report estimated soybean condition at 66% good-to-excellent (up 1% from last week) and 8% poor-to-very poor (same as last week); soybean blooming to be 66% compared to 50% last week, 60% last year, and a 5-year average of 60%. In Tennessee, soybean condition was estimated at 76% good-to-excellent (up 1% from last week) compared to 6% poor-to-very poor (down 1% from last week); blooming to be 82% compared to 73% last week, 58% last year, and a 5-year average of 60%. For the week of July 10-16, 2026, there were net sales of 56,400 MT for 2025/2026 were down 70 percent from the previous week and from the prior 4-week average. Net sales of 1,537,200 MT for 2026/2027 primarily for China (1,006,000 MT), Mexico (329,700 MT), unknown destinations (132,000 MT), Egypt (53,000 MT), and Colombia (10,000 MT), were offset by reductions for Hong Kong (5,000 MT). Exports of 298,700 MT were down 34 percent from the previous week and 27 percent from the prior 4-week average. The destinations were primarily to China (65,600 MT), Mexico (65,400 MT), the Netherlands (58,700 MT), Japan (30,200 MT), and Canada (26,700 MT). November 2026 soybean futures closed at $12.54, up 51 cents compared to last week.
Cotton
North Delta upland cotton spot price quotes for July 21st were up compared to last week. Prices were 75.21 cents/lb (41-4-34), and 79.96 cents/lb (31-3-35), which made both down 0.39 cents compared to last week’s prices.
| Cotton | Dec 26 | Change | Mar 27 | Change |
|---|---|---|---|---|
| Price | $79.98 | $1.35 | $81.64 | $1.63 |
| Support | $79.04 | $1.22 | $81.00 | $1.78 |
| Resistance | $80.92 | $1.56 | $82.61 | $1.88 |
| 20 Day MA | $79.53 | $0.53 | $80.93 | $0.56 |
| 50 Day MA | $79.47 | -0.52 | $80.69 | -$0.44 |
| 100 Day MA | $78.06 | $0.54 | $79.10 | $0.56 |
| 4-week High | $82.96 | $0.00 | $84.26 | $0.00 |
| 4-Week Low | $75.50 | $0.00 | $76.86 | $0.00 |
| Technical Trend | DOWN | = | DOWN | = |
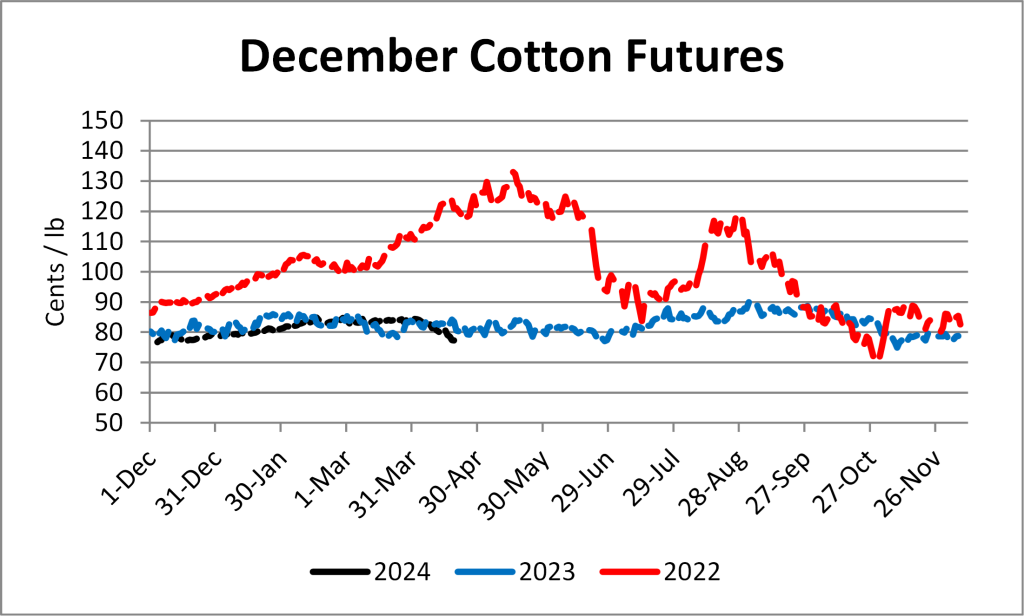
Nationally, the Crop Progress report estimated cotton condition at 45% good-to-excellent (up 1% from last week) and 18% poor-to-very poor (up 2% from last week); cotton squaring to be 73% compared to 60% last week, 70% last year, and a 5-year average of 72%. In Tennessee, the Crop Progress report estimated cotton condition at 63% good-to-excellent (up 4% from last week) and 16% poor-to-very poor (same as last week); cotton squaring to be 86% compared to 80% last week, 68% last year, and a 5-year average of 79%. For the week July 10-16, 2026, there was a total net sales of Upland totaling 51,300 RB for 2025/2026 were up 49 percent from the previous week, but down 12 percent from the prior 4-week average. Net sales of 16,100 RB for 2026/2027 primarily for Vietnam (7,100 RB), India (4,700 RB), Pakistan (2,200 RB), Peru (1,500 RB), and Mexico (1,200 RB), were offset by reductions for South Korea (1,900 RB), Nicaragua (1,900 RB), and Guatemala (100 RB). Exports of 276,300 RB were up 29 percent from the previous week and 15 percent from the prior 4-week average. The destinations were primarily to Vietnam (96,300 RB), Pakistan (42,700 RB), Turkey (31,800 RB), India (20,400 RB), and Bangladesh (16,400 RB). For the week, December 2026 cotton futures closed at 79,98 cents, up 1.35 cents compared to last week. March 2027 cotton futures closed at 81.64 cents, up 1.63 cents compared to last week.
Wheat
Wheat cash prices at elevators and barge points ranged from $6.14 to $6.87.
| Wheat | July 27 | Change | Sep 26 | Change |
|---|---|---|---|---|
| Price | $7.15 | -$0.01 | $6.78 | -$0.04 |
| Support | $7.03 | -$0.02 | $6.64 | -$0.07 |
| Resistance | $7.26 | $0.04 | $6.91 | $0.02 |
| 20 Day MA | $6.78 | $0.18 | $6.40 | $0.21 |
| 50 Day MA | $6.74 | $0.04 | $6.31 | $0.04 |
| 100 Day MA | $6.67 | $0.05 | $6.29 | $0.05 |
| 4-week High | $7.42 | $0.22 | $7.11 | $0.13 |
| 4-Week Low | $6.22 | $0.00 | $5.74 | $0.00 |
| Technical Trend | UP | = | UP | = |
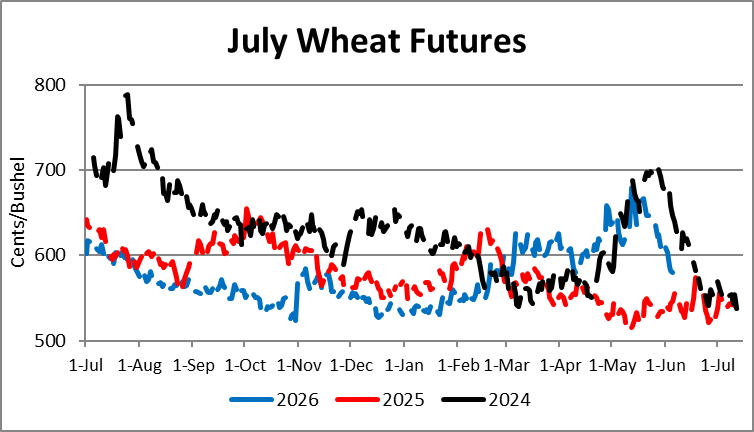
Nationally, the Crop Progress report estimated spring wheat headed to be 86% compared to 72% last week, 86% last year, and a 5-year average of 85%. The report estimated winter wheat harvested to be 74% compared to 67% last week, 72% last year, and a 5-year average of 71%. For the week of July 10-16, 2026, net sales of 290,000 metric tons (MT) for 2026/2027 were up 23% from the previous week and down 14% from the prior 4-week average. Exports of 210,600 MT were down 50% from the previous week and down 42% from the prior 4-week average. The destinations were primarily to Mexico (120,700 MT), Chile (52,000 MT), Jamaica (9,600 MT), El Salvador (7,800 MT), and Haiti (7,300 MT).
Additional Information
Links for data presented:
U.S. Export Sales – https://apps.fas.usda.gov/export-sales/esrd1.html
USDA FAS: Weekly Export Performance Indicator – https://apps.fas.usda.gov/esrquery/esrpi.aspx
EIA: Weekly ethanol Plant Production – https://www.eia.gov/dnav/pet/pet_pnp_wprode_s1_w.htm
EIA: Weekly Supply Estimates – https://www.eia.gov/dnav/pet/pet_sum_sndw_a_EPOOXE_sae_mbbl_w.htm
Upland Cotton Reports – https://www.fsa.usda.gov/FSA/epasReports?area=home&subject=ecpa&topic=fta-uc
Tennessee Crop Progress – https://www.nass.usda.gov/Statistics_by_State/Tennessee/Publications/Crop_Progress_&_Condition/
U.S. Crop Progress – http://usda.mannlib.cornell.edu/MannUsda/viewDocumentInfo.do?documentID=1048
USDA AMS: Market News – https://www.ams.usda.gov/market-news/search-market-news
If you would like further information or clarification on topics discussed in the crop comments section or would like to be added to our free email list please contact me at agriff14@utk.edu.