by Charley Martinez, Farm Management Specialist
December 19, 2025
Overview
Corn slightly up for the week; Soybeans, Cotton, and Wheat down for the week.
This week marks the last of the weekly comments for this year. Thank you to everyone that reads these every week. I hope every one has a great couple of weeks during these holidays.
This week we got some news in the trade front as the government still plays catch up from the shutdown. There were 312,000 MTs of soybean sales to China for the week ending November 27th. I would expect for the data from the shutdown to catch up during these two shortened weeks.
The Cotton Ginnings report came out this week and had Tennessee at 360,100 bales, which was down from 529,600 from last year. Crockett and Haywood were the two highest producing counties.
As mentioned above hopefully data that was missed during the shutdown catches up these next two weeks and we can start fresh and up to date in 2026. Until then, I hope everyone has a great holiday season!
| Indicator | Previous | Current | Change |
|---|---|---|---|
| USD Index | 98.99 | 98.41 | -0.58 |
| Crude Oil | 60.02 | 57.47 | -2.55 |
| DJIA | 47996 | 48458 | 462 |
Corn
Across Tennessee, average corn basis (cash price-nearby futures price) weakened from last week at West, Northwest, West-Central, North-Central, and Mississippi River elevators and barge points. Overall, basis for the week ranged from 11 cents under to 19 cents over, with an average of 6 cents over with the March futures at elevators and barge points. Ethanol production for the week ending December 12th was 1.131 million barrels, up 26,000 barrels compared to the previous week. Ethanol stocks were 22.535 million barrels, up 25,000 barrels compared to last week. Cash prices ranged from $4.27 to $4.71 at elevators and barge points. On Friday, March 2026 corn futures closed at $4.43, which is up 3 cents compared to last Friday. For the week, March 2026 corn futures traded between $4.35 and $4.44.
| Corn | Dec 25 | Change | Mar 26 | Change |
|---|---|---|---|---|
| Price | $4.31 | -$0.05 | $4.40 | -$0.04 |
| Support | $4.27 | -$0.06 | $4.38 | -$0.05 |
| Resistance | $4.36 | -$0.04 | $4.45 | -$0.04 |
| 20 Day MA | $4.32 | $0.00 | $4.44 | $0.00 |
| 50 Day MA | $4.28 | $0.02 | $4.41 | $0.01 |
| 100 Day MA | $4.21 | $0.01 | $4.36 | $0.00 |
| 4-Week High | $4.42 | $0.00 | $4.34 | $0.00 |
| 4-Week Low | $4.22 | $0.00 | $4.57 | $0.00 |
| Technical Trend | DOWN | = | DOWN | = |

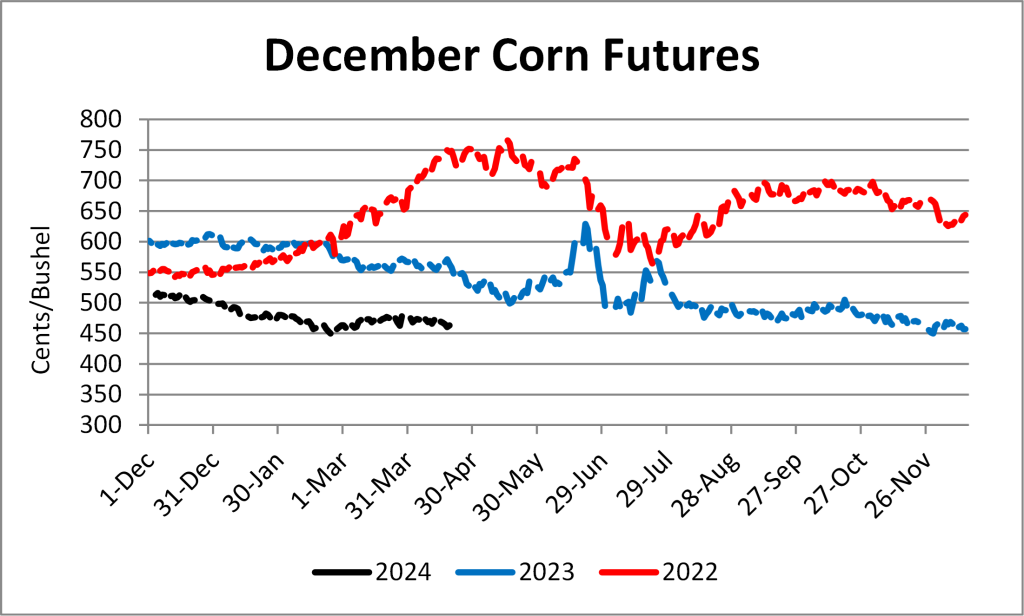
This week, new crop cash contracts ranged from $4.27 to $4.77 at elevators and barge points. September 2026 corn futures closed at $4.51, up 1 cent compared to the previous Friday. The December contract finished last week and I have left the yearly data in the chart below to highlight that prices ended the year relatively the same as last year. As we work our way through this year, any sign of prices being higher should be thought about in terms of locking in for a position.
Soybeans
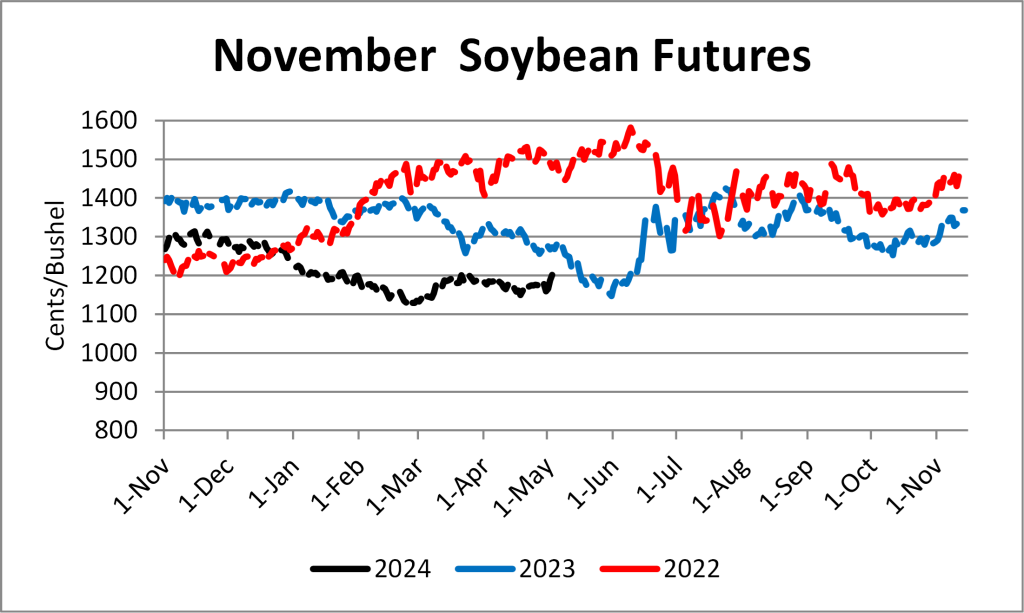
Across Tennessee average soybean basis remained relatively unchanged compared to last week at West, Northwest, North-Central, West-Central, and Mississippi River elevators and barge points. Average basis ranged from 31 under to 24 over the January futures contract, with an average basis at the end of the week of 4 cents over. Cash soybean prices at elevators and barge points ranged from $10.24 to $11.01. January 2026 soybean futures closed at $10.49, down 27 cents compared to last Friday. For the week, January 2026 soybean futures traded between $10.47 and $10.80.
| Soybeans | Jan 26 | Change | Sep 26 | Change |
|---|---|---|---|---|
| Price | $10.76 | -$0.29 | $10.83 | -$0.21 |
| Support | $10.70 | -$0.29 | $10.78 | -$0.21 |
| Resistance | $10.88 | -$0.28 | $10.92 | -$0.20 |
| 20 Day MA | $11.18 | -$0.11 | $11.12 | -$0.06 |
| 50 Day MA | $10.93 | $0.06 | $10.95 | $0.03 |
| 100 Day MA | $10.68 | $0.02 | $10.80 | $0.01 |
| 4-Week High | $11.69 | $0.00 | $11.34 | $0.00 |
| 4-Week Low | $10.75 | -$0.28 | $10.82 | -$0.13 |
| Technical Trend | DOWN | = | DOWN | = |

September 2026 soybean futures closed at $10.63, down 20 cents since last Friday.
Cotton
North Delta upland cotton spot price quotes for December 19th were down to 61.26 cents/lb (41-4-34) and 66.01 cents/lb (31-3-35).
| Cotton | Mar 26 | Change | May 26 | Change |
|---|---|---|---|---|
| Price | 63.83 | -0.10 | 64.91 | -0.09 |
| Support | 63.62 | -0.31 | 64.72 | |
| Resistance | 64.12 | -0.17 | 65.18 | |
| 20 Day MA | 64.13 | -0.31 | 65.29 | |
| 50 Day MA | 65.24 | -0.37 | 66.44 | |
| 100 Day MA | 66.92 | -0.29 | 68.16 | |
| 4-Week High | 65.12 | -1.38 | 66.26 | |
| 4-Week Low | 63.11 | 0.00 | 64.39 | |
| Technical Trend | DOWN | = | DOWN | = |

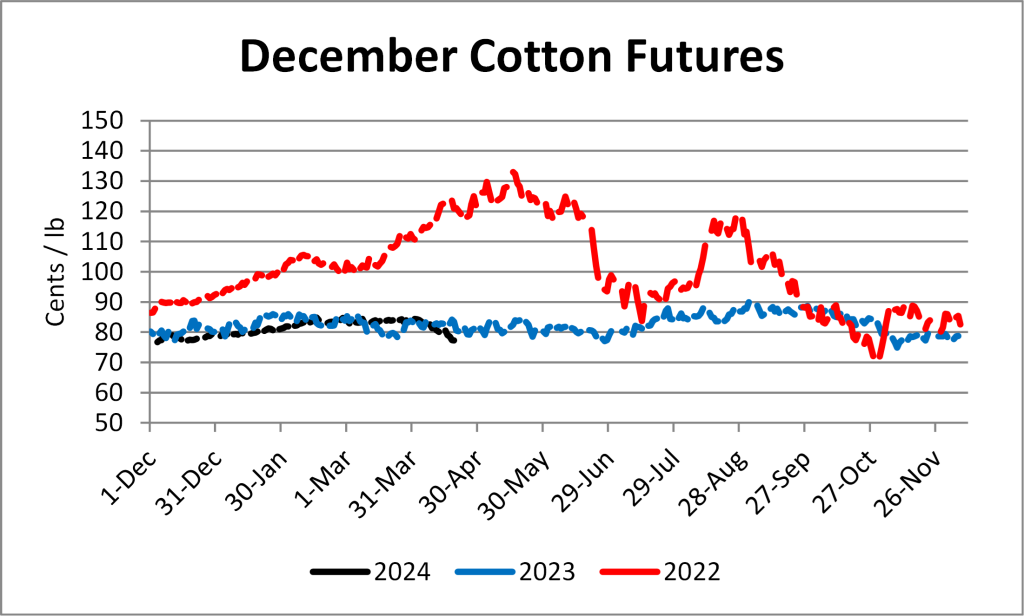
For the week, March 2026 cotton futures closed at 63.75 on Friday, which is down .08 cents compared to last week. It traded between 62.97 to 64.39 cents. Dec/Mar and Dec/May cotton futures spreads were -3.55 cents and -2.46 cents. May 2026 cotton futures closed at 64.84 cents, down .07 cents compared to last Friday. December 2026 cotton futures closed at 67.3 cents, down .23 cents compared to last Friday.
Wheat
Wheat cash prices at elevators and barge points ranged from $4.61 to $4.76.
| Wheat | Dec 25 | Change | Jul 26 | Change |
|---|---|---|---|---|
| Price | $5.34 | -$0.03 | $5.45 | -$0.06 |
| Support | $5.34 | -$0.02 | $5.43 | -$0.05 |
| Resistance | $5.34 | -$0.04 | $5.49 | -$0.06 |
| 20 Day MA | $5.33 | $0.00 | $5.56 | -$0.06 |
| 50 Day MA | $5.25 | $0.02 | $5.57 | $0.00 |
| 100 Day MA | $5.26 | -$0.02 | $5.62 | -$0.02 |
| 4-Week High | $5.50 | -$0.04 | $5.82 | -$0.02 |
| 4-Week Low | $5.19 | $0.00 | $5.42 | -$0.04 |
| Technical Trend | DOWN | = | DOWN | = |

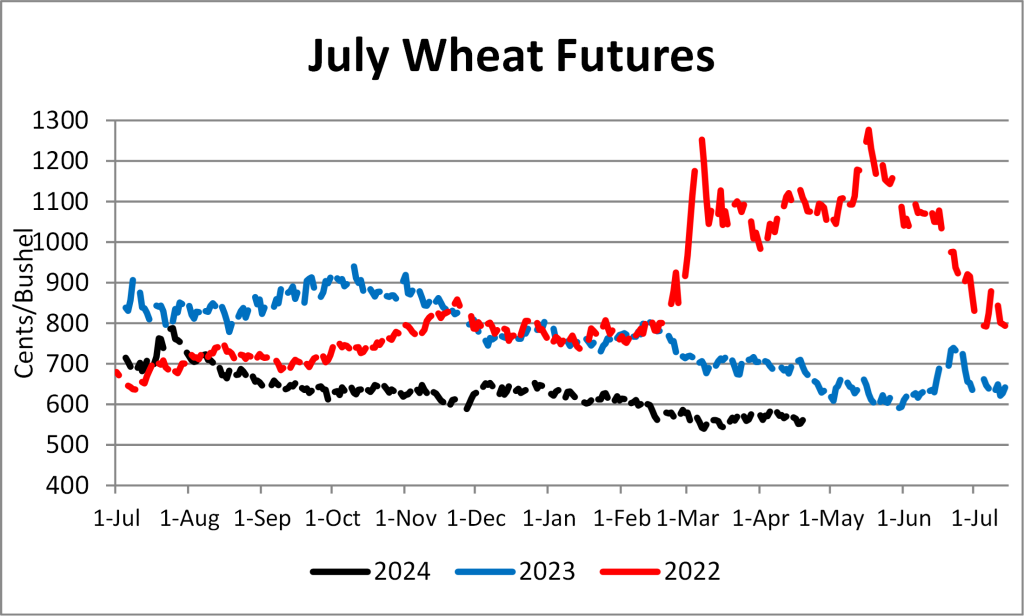
July 2026 wheat futures closed at $5.31, down 14 cents compared to last Friday. July 2026 wheat futures traded between $5.26 and $5.45 this week. September 2026 wheat futures closed at $5.45, down 13 cents since last Friday.
Additional Information
Links for data presented:
U.S. Export Sales – https://apps.fas.usda.gov/export-sales/esrd1.html
USDA FAS: Weekly Export Performance Indicator – https://apps.fas.usda.gov/esrquery/esrpi.aspx
EIA: Weekly ethanol Plant Production – https://www.eia.gov/dnav/pet/pet_pnp_wprode_s1_w.htm
EIA: Weekly Supply Estimates – https://www.eia.gov/dnav/pet/pet_sum_sndw_a_EPOOXE_sae_mbbl_w.htm
Upland Cotton Reports – https://www.fsa.usda.gov/FSA/epasReports?area=home&subject=ecpa&topic=fta-uc
Tennessee Crop Progress – https://www.nass.usda.gov/Statistics_by_State/Tennessee/Publications/Crop_Progress_&_Condition/
U.S. Crop Progress – http://usda.mannlib.cornell.edu/MannUsda/viewDocumentInfo.do?documentID=1048
USDA AMS: Market News – https://www.ams.usda.gov/market-news/search-market-news
If you would like further information or clarification on topics discussed in the crop comments section or would like to be added to our free email list please contact me at cmart113@utk.edu.